$SOL 📊 SOLANA (SOL) TECHNICAL ANALYSIS
📅 Market Update – November 10, 2026
🔴 $SOL – Bearish Market Outlook
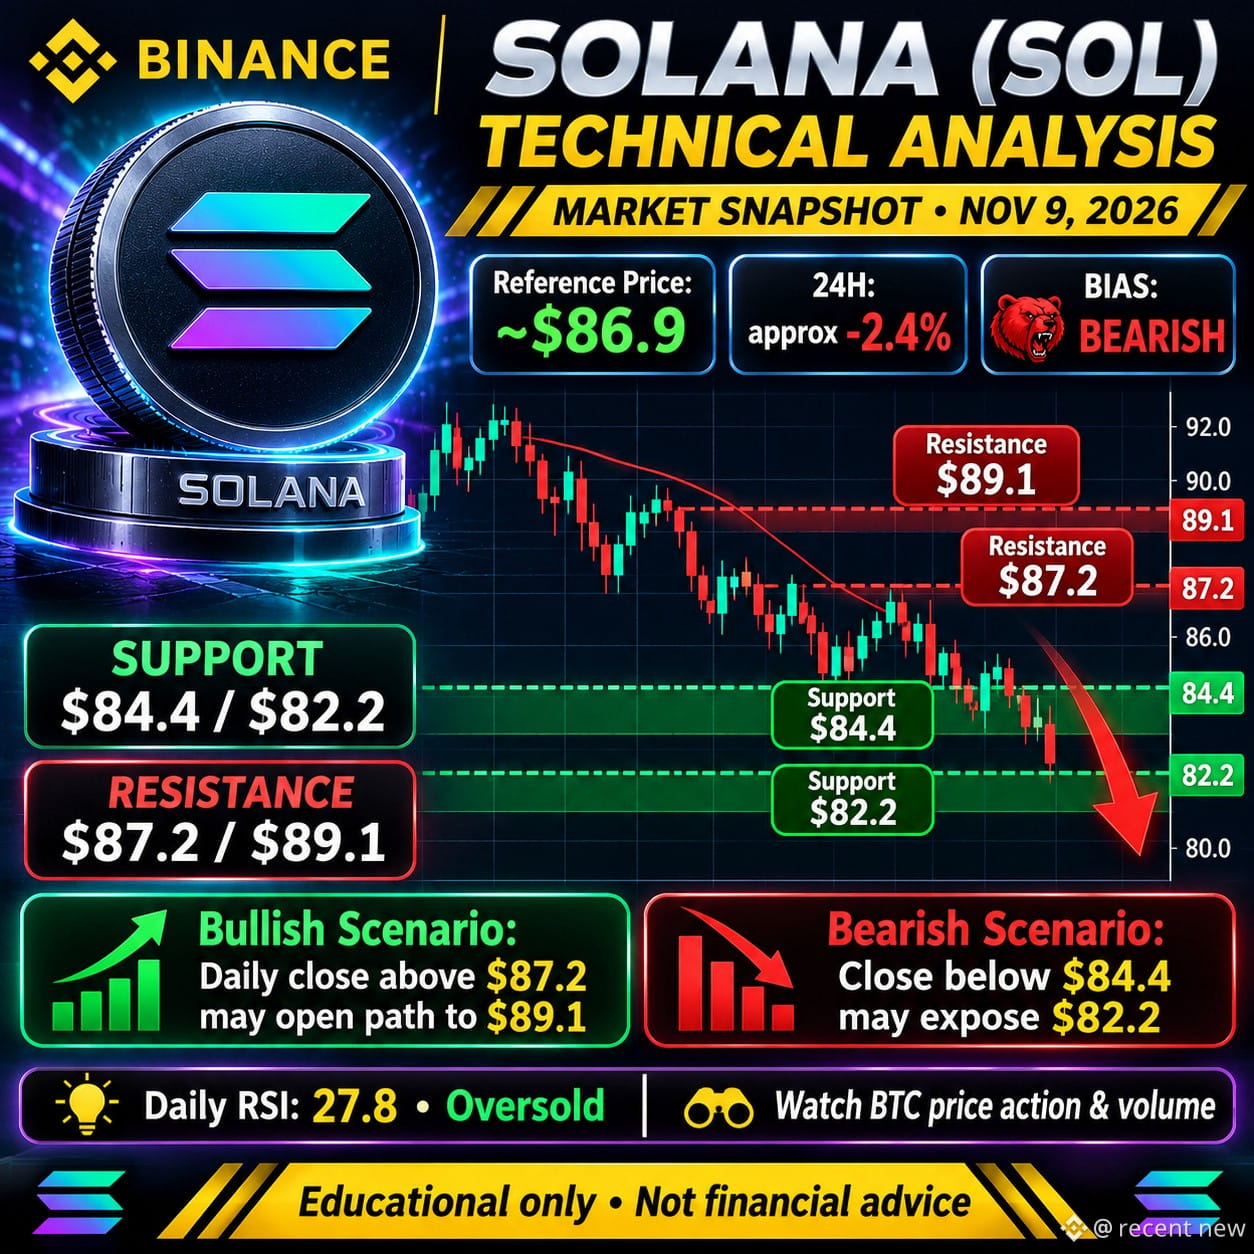
Solana ($SOL ) is currently showing bearish momentum, with sellers maintaining control of the market. Price action indicates continued downside pressure, while traders are watching key support zones for a possible reversal.
💰 Market Overview
• Reference Price: $86.9
• 24H Change: -2.4%
• Market Bias: Bearish
📉 Key Technical Levels
🔹 Resistance Zone 1: $87.2
🔹 Resistance Zone 2: $89.1
🟢 Support Zone 1: $84.4
🟢 Support Zone 2: $82.2
🎯 Possible Market Scenarios
📈 Bullish Scenario:
If SOL closes above $87.2 with strong buying volume, the price may move toward $89.1.
📉 Bearish Scenario:
If SOL breaks below $84.4, further downside toward $82.2 may become possible.
📊 Technical Insight
The RSI reference value of 27.8 indicates oversold conditions. However, oversold does not guarantee a bullish reversal. Traders should wait for confirmation through price action and volume.
⚠️ Trading Strategy
• Monitor Bitcoin's movement.
• Avoid emotional entries.
• Follow strict risk management.
• Wait for confirmation before entering a trade.
🚀 Stay Updated. Trade Smart. Manage Risk.
#SOL #Solana #SOLAnalysis #CryptoTrading #BinanceSquare #TechnicalAnalysis #CryptoMarket #Bitcoin #Altcoins
⚠️ Educational content only. Not financial advice.
#CPITestsDecemberRateOutlook #NvidiaInvestigatesAfterHuang’sAffairApology #AnthropicRejectsIPODelayValuationinQuestion #US-IranTalksFuelStrongStockMarketRebound #BitcoinFiveWeeklyLosses
📅 Market Update – November 10, 2026
🔴 $SOL – Bearish Market Outlook
Solana ($SOL ) is currently showing bearish momentum, with sellers maintaining control of the market. Price action indicates continued downside pressure, while traders are watching key support zones for a possible reversal.
💰 Market Overview
• Reference Price: $86.9
• 24H Change: -2.4%
• Market Bias: Bearish
📉 Key Technical Levels
🔹 Resistance Zone 1: $87.2
🔹 Resistance Zone 2: $89.1
🟢 Support Zone 1: $84.4
🟢 Support Zone 2: $82.2
🎯 Possible Market Scenarios
📈 Bullish Scenario:
If SOL closes above $87.2 with strong buying volume, the price may move toward $89.1.
📉 Bearish Scenario:
If SOL breaks below $84.4, further downside toward $82.2 may become possible.
📊 Technical Insight
The RSI reference value of 27.8 indicates oversold conditions. However, oversold does not guarantee a bullish reversal. Traders should wait for confirmation through price action and volume.
⚠️ Trading Strategy
• Monitor Bitcoin's movement.
• Avoid emotional entries.
• Follow strict risk management.
• Wait for confirmation before entering a trade.
🚀 Stay Updated. Trade Smart. Manage Risk.
#SOL #Solana #SOLAnalysis #CryptoTrading #BinanceSquare #TechnicalAnalysis #CryptoMarket #Bitcoin #Altcoins
⚠️ Educational content only. Not financial advice.
#CPITestsDecemberRateOutlook #NvidiaInvestigatesAfterHuang’sAffairApology #AnthropicRejectsIPODelayValuationinQuestion #US-IranTalksFuelStrongStockMarketRebound #BitcoinFiveWeeklyLosses