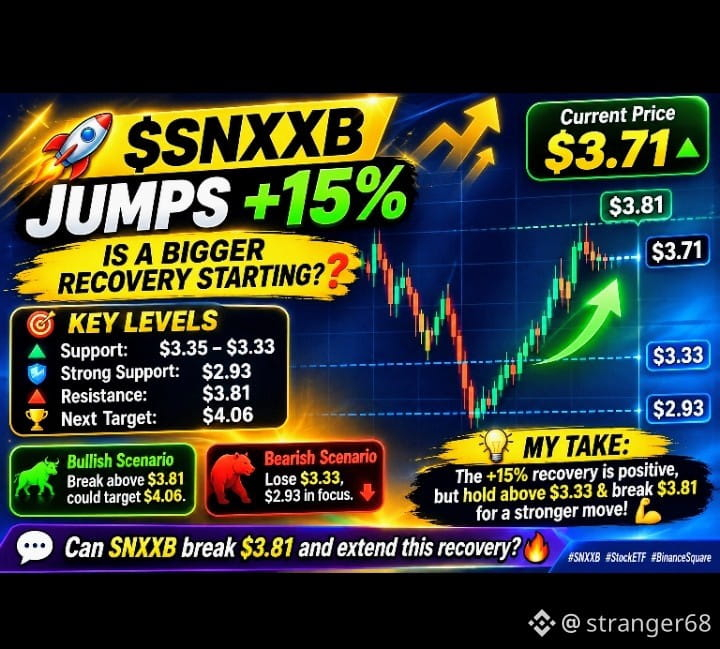
🚀 $SNXXB JUMPS +15% — IS A BIGGER RECOVERY STARTING? ⚡📈
🔥 SNXXB/USDT is showing fresh buying strength after bouncing from $2.93. Price is now trading around $3.71, with momentum building and bulls attempting to extend the recovery. 💥
⏱️ 1H Chart: Price has climbed above MA(25) at $3.35 and MA(99) at $3.33, showing improving short-term momentum. Holding above these averages could support another push higher. 📊
🕓 4H Chart: The recovery is encouraging, but the bigger trend remains under pressure. Price is above the short-term moving averages while the MA(99) near $6.46 remains a major overhead barrier. 🧭
📅 1D Chart: The daily structure is still bearish, with price below MA(7) at $4.06 and MA(25) at $7.25. A sustained recovery is needed to improve the broader outlook. 🌱
🎯 KEY LEVELS TO WATCH
🟢 Support: $3.35–$3.33
🛡️ Strong Support: $2.93
🚀 Immediate Resistance: $3.81
🎯 Next Target: $4.06
🔥 Bullish Scenario: A convincing breakout above $3.81 could open the way toward $4.06.
⚠️ Bearish Scenario: Losing $3.33 could bring selling pressure back, with $2.93 as the critical downside level.
💡 MY TAKE: The +15% recovery is a positive sign, but the daily chart still needs confirmation. Holding above $3.33 and breaking $3.81 would make the recovery more convincing. Remember, this is a leveraged 2X ETF, so volatility and risk are amplified. ⚖️
🔥 Can SNXXB break $3.81 and extend this recovery, or will sellers step in again? Share your view below! 💬
#SNXXB #StockETF #BinanceSquare
#CPITestsDecemberRateOutlook #BitcoinFiveWeeklyLosses #NvidiaInvestigatesAfterHuang’sAffairApology #AIChipSlumpNasdaq
🔥 SNXXB/USDT is showing fresh buying strength after bouncing from $2.93. Price is now trading around $3.71, with momentum building and bulls attempting to extend the recovery. 💥
⏱️ 1H Chart: Price has climbed above MA(25) at $3.35 and MA(99) at $3.33, showing improving short-term momentum. Holding above these averages could support another push higher. 📊
🕓 4H Chart: The recovery is encouraging, but the bigger trend remains under pressure. Price is above the short-term moving averages while the MA(99) near $6.46 remains a major overhead barrier. 🧭
📅 1D Chart: The daily structure is still bearish, with price below MA(7) at $4.06 and MA(25) at $7.25. A sustained recovery is needed to improve the broader outlook. 🌱
🎯 KEY LEVELS TO WATCH
🟢 Support: $3.35–$3.33
🛡️ Strong Support: $2.93
🚀 Immediate Resistance: $3.81
🎯 Next Target: $4.06
🔥 Bullish Scenario: A convincing breakout above $3.81 could open the way toward $4.06.
⚠️ Bearish Scenario: Losing $3.33 could bring selling pressure back, with $2.93 as the critical downside level.
💡 MY TAKE: The +15% recovery is a positive sign, but the daily chart still needs confirmation. Holding above $3.33 and breaking $3.81 would make the recovery more convincing. Remember, this is a leveraged 2X ETF, so volatility and risk are amplified. ⚖️
🔥 Can SNXXB break $3.81 and extend this recovery, or will sellers step in again? Share your view below! 💬
#SNXXB #StockETF #BinanceSquare
#CPITestsDecemberRateOutlook #BitcoinFiveWeeklyLosses #NvidiaInvestigatesAfterHuang’sAffairApology #AIChipSlumpNasdaq