$WBETH: The Mystery of High Effort Low Result
Why does a massive spike in activity sometimes fail to move the needle? It is a common misconception that high volume always guarantees a breakout. In a thought experiment known as the effort versus result paradox, we consider a scenario where intense participation meets equal resistance. If an asset sees a huge surge in relative volume 7.80077 but the price progress remains small, the effort has not yielded a proportional result. This is a hypothetical mechanism where opposing forces balance each other out perfectly.
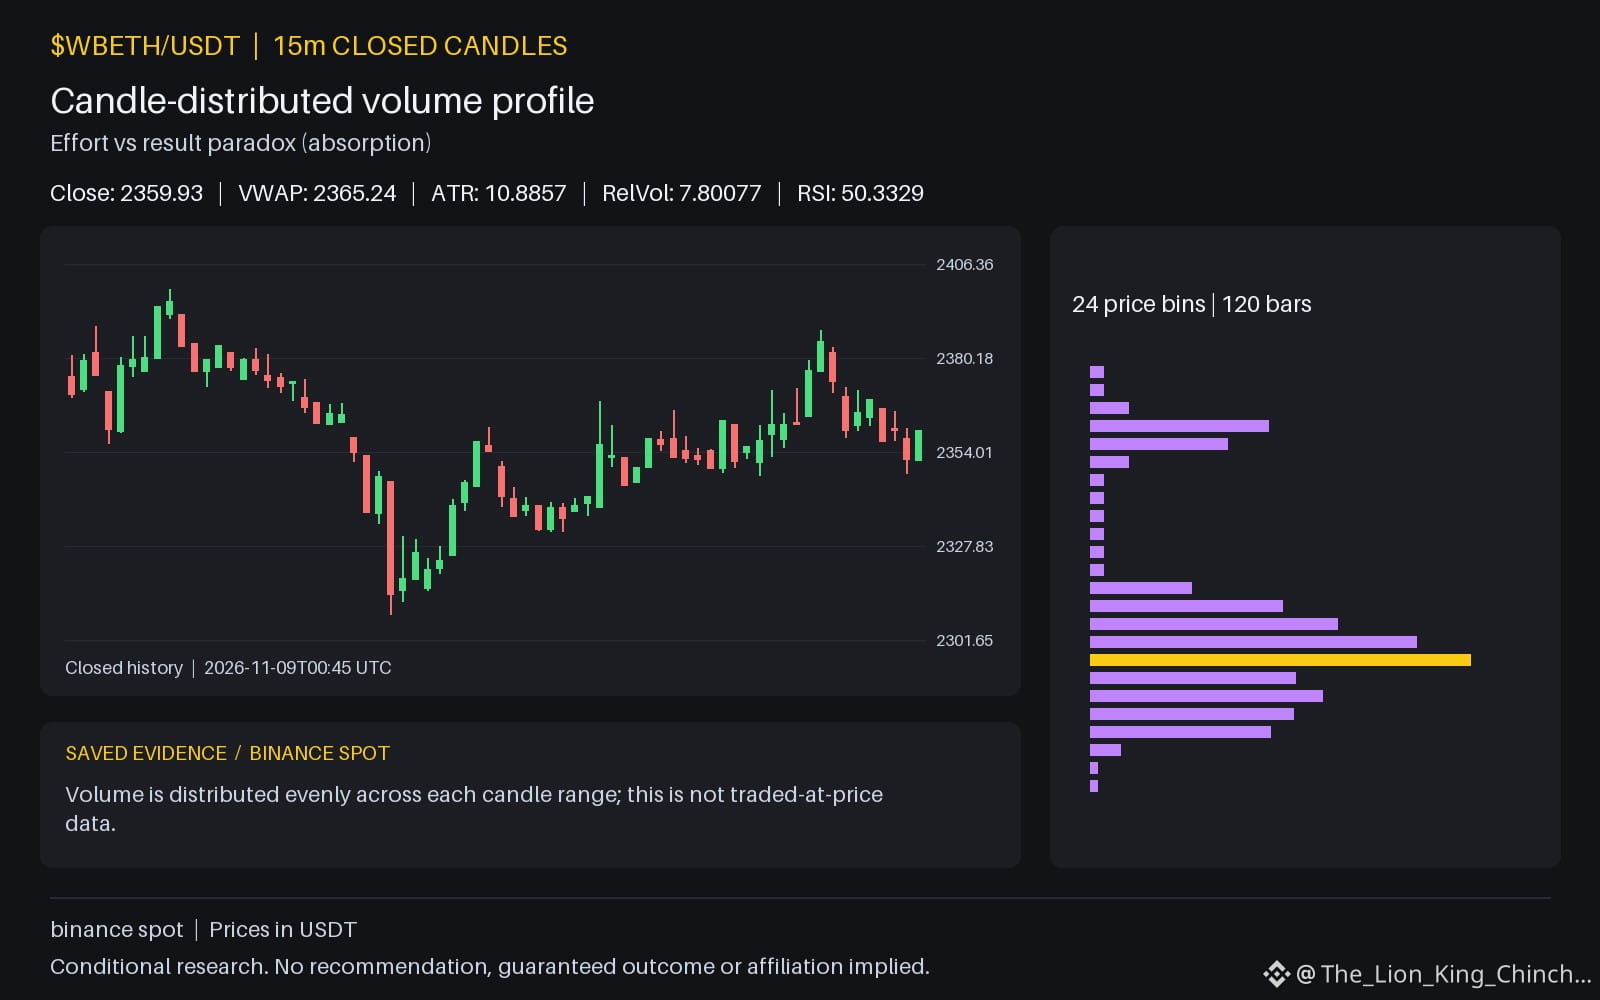
Could this explain the current state for $WBETH? We observe that the daily change is -4.68588 despite volume being above the baseline. The price sits at 2359.93 with a RSI of 50.3329. While the hourly direction is down, the lack of a large price swing despite the activity suggests a period of high friction. A counterexample would be a low-volume move that covers a wide price range, which suggests a path of least resistance. In contrast, seeing the MACD at 1.95829 near the signal 3.29494 while activity stays high reminds us that volume alone is not a direction. One way to reassess this is to check if the candle closes near its open or if it manages to clear the resistance at 2387.92. This thought experiment helps us avoid assuming that high volume must lead to a certain breakout.
Probabilistic market research, not a recommendation or guaranteed return.
Which crypto concept becomes clearer when you look at an actual chart?
#WBETH #CryptoLearning
Why does a massive spike in activity sometimes fail to move the needle? It is a common misconception that high volume always guarantees a breakout. In a thought experiment known as the effort versus result paradox, we consider a scenario where intense participation meets equal resistance. If an asset sees a huge surge in relative volume 7.80077 but the price progress remains small, the effort has not yielded a proportional result. This is a hypothetical mechanism where opposing forces balance each other out perfectly.
Could this explain the current state for $WBETH? We observe that the daily change is -4.68588 despite volume being above the baseline. The price sits at 2359.93 with a RSI of 50.3329. While the hourly direction is down, the lack of a large price swing despite the activity suggests a period of high friction. A counterexample would be a low-volume move that covers a wide price range, which suggests a path of least resistance. In contrast, seeing the MACD at 1.95829 near the signal 3.29494 while activity stays high reminds us that volume alone is not a direction. One way to reassess this is to check if the candle closes near its open or if it manages to clear the resistance at 2387.92. This thought experiment helps us avoid assuming that high volume must lead to a certain breakout.
Probabilistic market research, not a recommendation or guaranteed return.
Which crypto concept becomes clearer when you look at an actual chart?
#WBETH #CryptoLearning