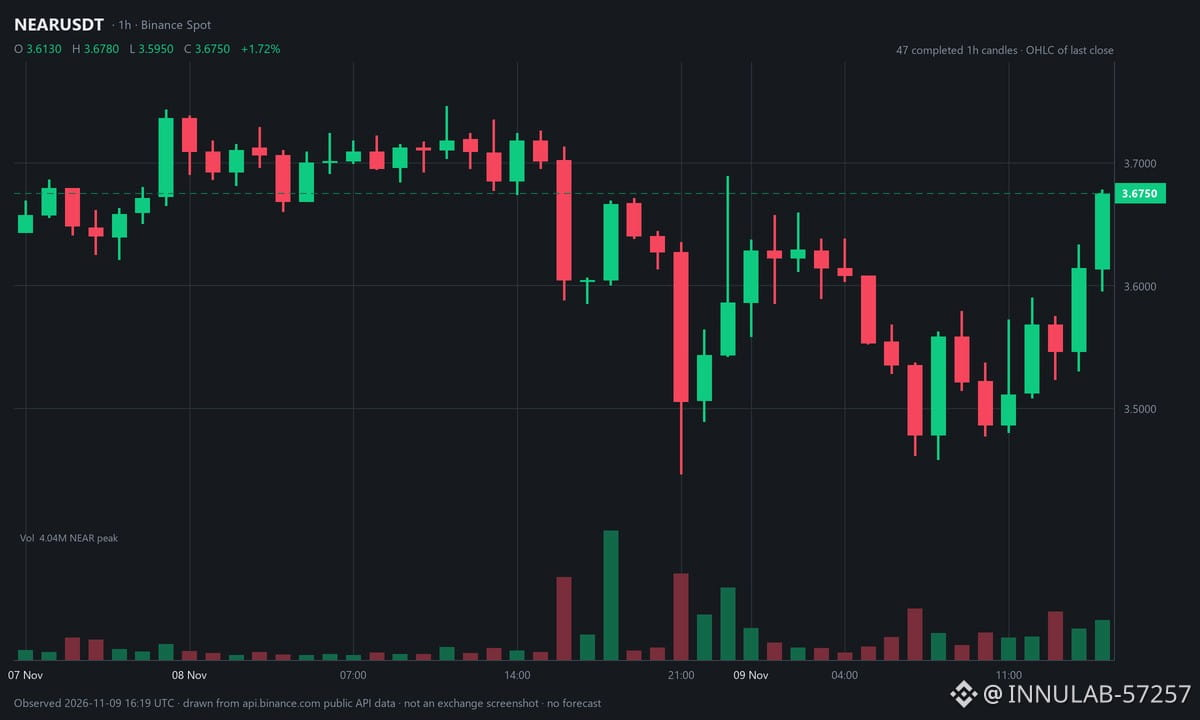
$NEAR 's seven-day chart and its one-day chart are telling different stories. Over the past week it's down about 9%, from a high of 4.27 to 3.63 now. Over the last 24 hours it's only down about 1.8%.
The hourly candles show what sits under that daily number. On the 8th, price slid from about 3.70 to 3.60 in the 16:00 UTC hour on 2.6M volume, then posted the biggest hourly volume of the window at 18:00 on the way back up. The sharpest leg came at 21:00, when it printed 3.446 on 2.7M volume and closed at 3.505. The 15:00 UTC candle on the 9th closed at 3.675.
That 21:00 volume is the part I'd check before trusting either percentage. Which window do you weigh more when they disagree?
The hourly candles show what sits under that daily number. On the 8th, price slid from about 3.70 to 3.60 in the 16:00 UTC hour on 2.6M volume, then posted the biggest hourly volume of the window at 18:00 on the way back up. The sharpest leg came at 21:00, when it printed 3.446 on 2.7M volume and closed at 3.505. The 15:00 UTC candle on the 9th closed at 3.675.
That 21:00 volume is the part I'd check before trusting either percentage. Which window do you weigh more when they disagree?