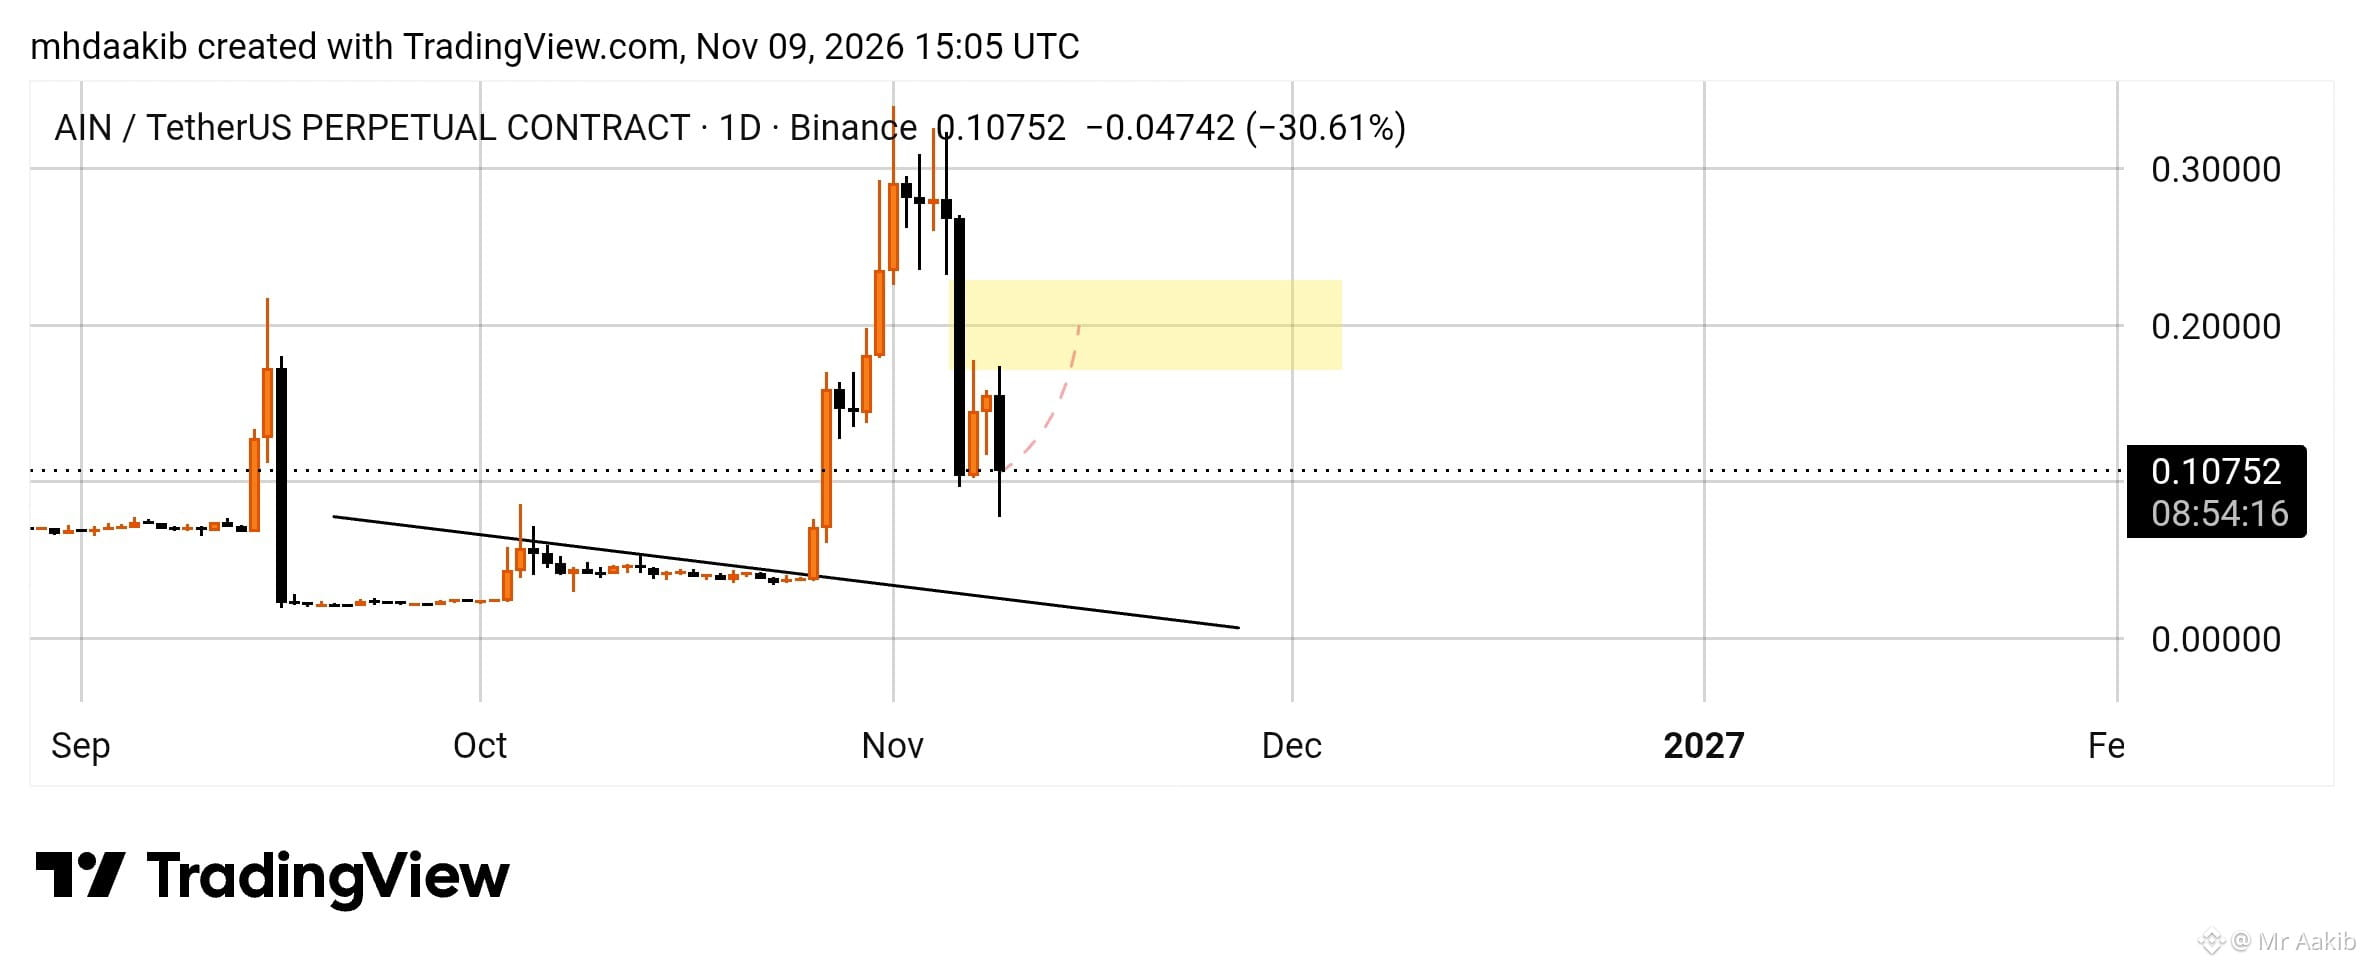
Will $AIN test this major supply zone for a relief bounce or continue its sharp correction? 📉
$AIN
on the 1-day chart is trading down at $0.10752 (-30.61%), experiencing an aggressive pullback following a rejection from local highs and plunging below key structural levels.
With price testing local footing near previous breakout zones right under the $0.1500–$0.2000 supply area, will buyers step in to trigger a reversal curve toward overhead resistance, or will the correction extend deeper?
Drop your prediction below! 👇
#AIN #BinanceSquare #CryptoUpdate #TechnicalAnalysis #Correction
$AIN
on the 1-day chart is trading down at $0.10752 (-30.61%), experiencing an aggressive pullback following a rejection from local highs and plunging below key structural levels.
With price testing local footing near previous breakout zones right under the $0.1500–$0.2000 supply area, will buyers step in to trigger a reversal curve toward overhead resistance, or will the correction extend deeper?
Drop your prediction below! 👇
#AIN #BinanceSquare #CryptoUpdate #TechnicalAnalysis #Correction