BTC is down almost 3% today and most of the majors are bleeding, but $PEPE is one of the few big names on Binance still printing green.
Not a huge move, around 1 to 2% on the day, but on a red board that relative strength stands out. Daily volume has also been noticeably higher in November than it was in mid October.
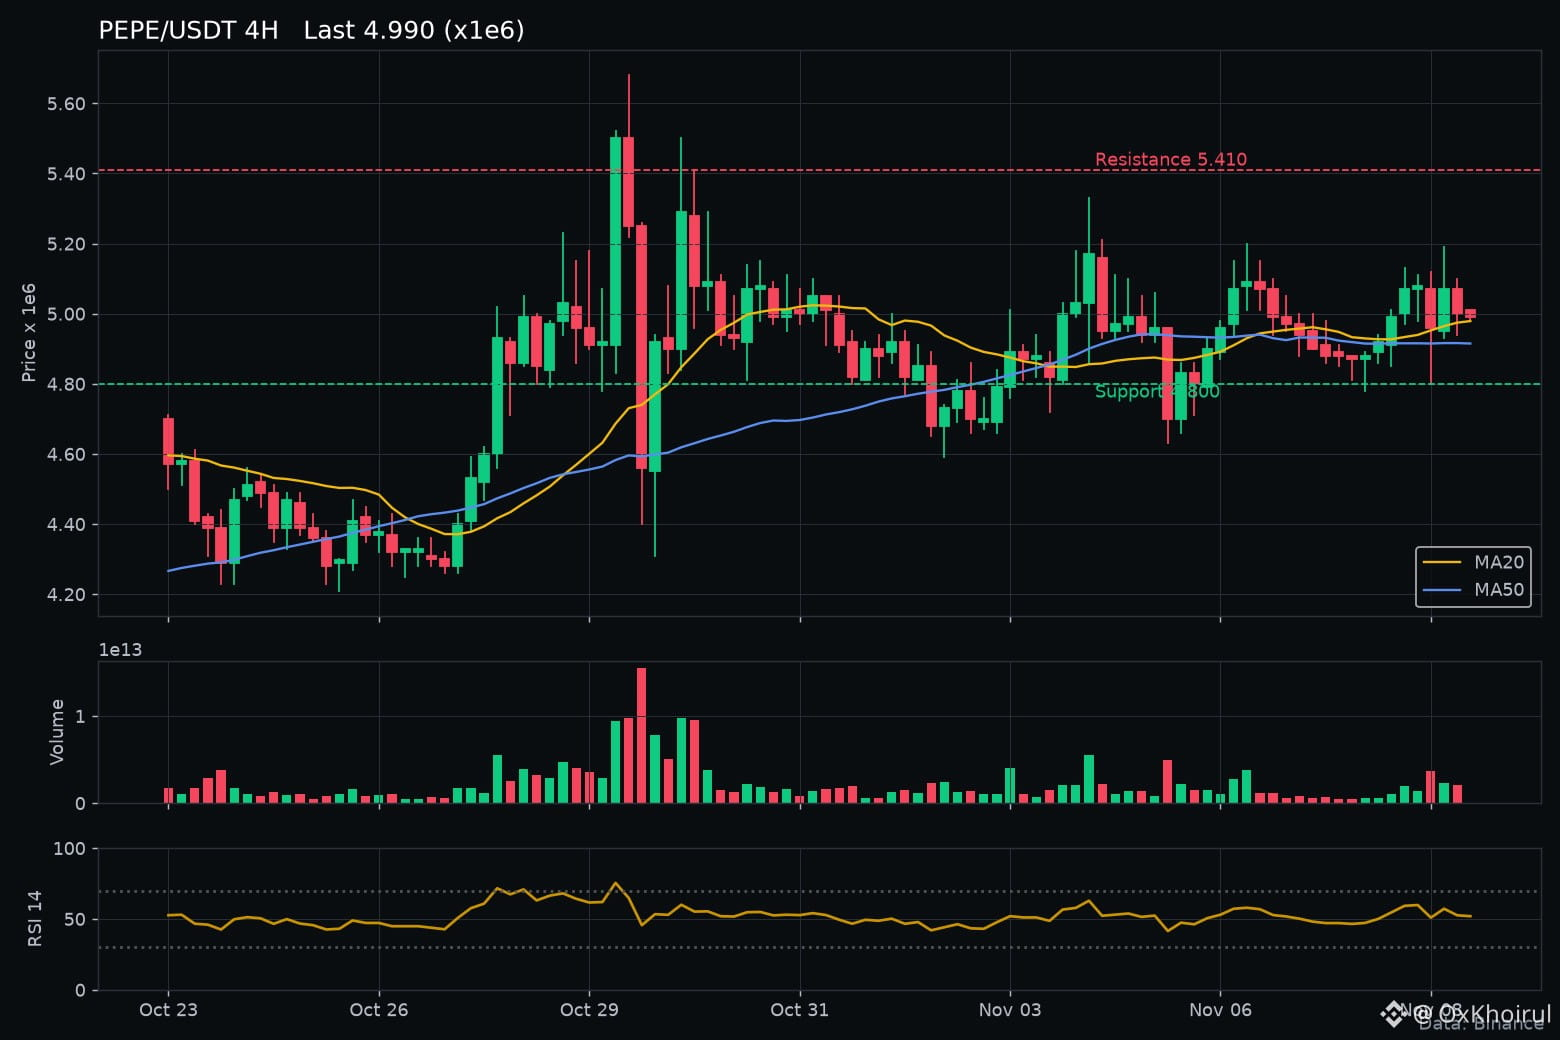
What I see on the 4H chart (prices in millionths, so 5.00 means 0.00000500):
Price is chopping in a tight range between roughly 4.80 and 5.19 for the past week. Every dip toward 4.80 got bought so far.
MA20 sits near 4.98 and MA50 near 4.92. Price is right on top of both and they are basically flat, so the trend is neutral, not bullish yet.
RSI 14 is around 52. Nothing overheated, nothing oversold. Pure coiling.
Bigger picture, the Oct 29 spike topped near 5.68 and the 5.41 area is where sellers stepped in on the way down. That zone is the ceiling on this chart.
Scenarios:
If price can close 4H candles above 5.19 with volume picking up, the 5.41 area is the next real test.
If 4.80 gives way, especially with BTC still weak, the range likely breaks down toward the 4.60 zone where the early November lows sit.
Not financial advice, DYOR.
Is PEPE quietly holding up because meme money is rotating in, or is it just late to follow BTC down?
#PEPE #MemeCoins #CryptoAnalysis #Altcoins
Not a huge move, around 1 to 2% on the day, but on a red board that relative strength stands out. Daily volume has also been noticeably higher in November than it was in mid October.
What I see on the 4H chart (prices in millionths, so 5.00 means 0.00000500):
Price is chopping in a tight range between roughly 4.80 and 5.19 for the past week. Every dip toward 4.80 got bought so far.
MA20 sits near 4.98 and MA50 near 4.92. Price is right on top of both and they are basically flat, so the trend is neutral, not bullish yet.
RSI 14 is around 52. Nothing overheated, nothing oversold. Pure coiling.
Bigger picture, the Oct 29 spike topped near 5.68 and the 5.41 area is where sellers stepped in on the way down. That zone is the ceiling on this chart.
Scenarios:
If price can close 4H candles above 5.19 with volume picking up, the 5.41 area is the next real test.
If 4.80 gives way, especially with BTC still weak, the range likely breaks down toward the 4.60 zone where the early November lows sit.
Not financial advice, DYOR.
Is PEPE quietly holding up because meme money is rotating in, or is it just late to follow BTC down?
#PEPE #MemeCoins #CryptoAnalysis #Altcoins