🔴 $WIF /USDT · Bias: SHORT
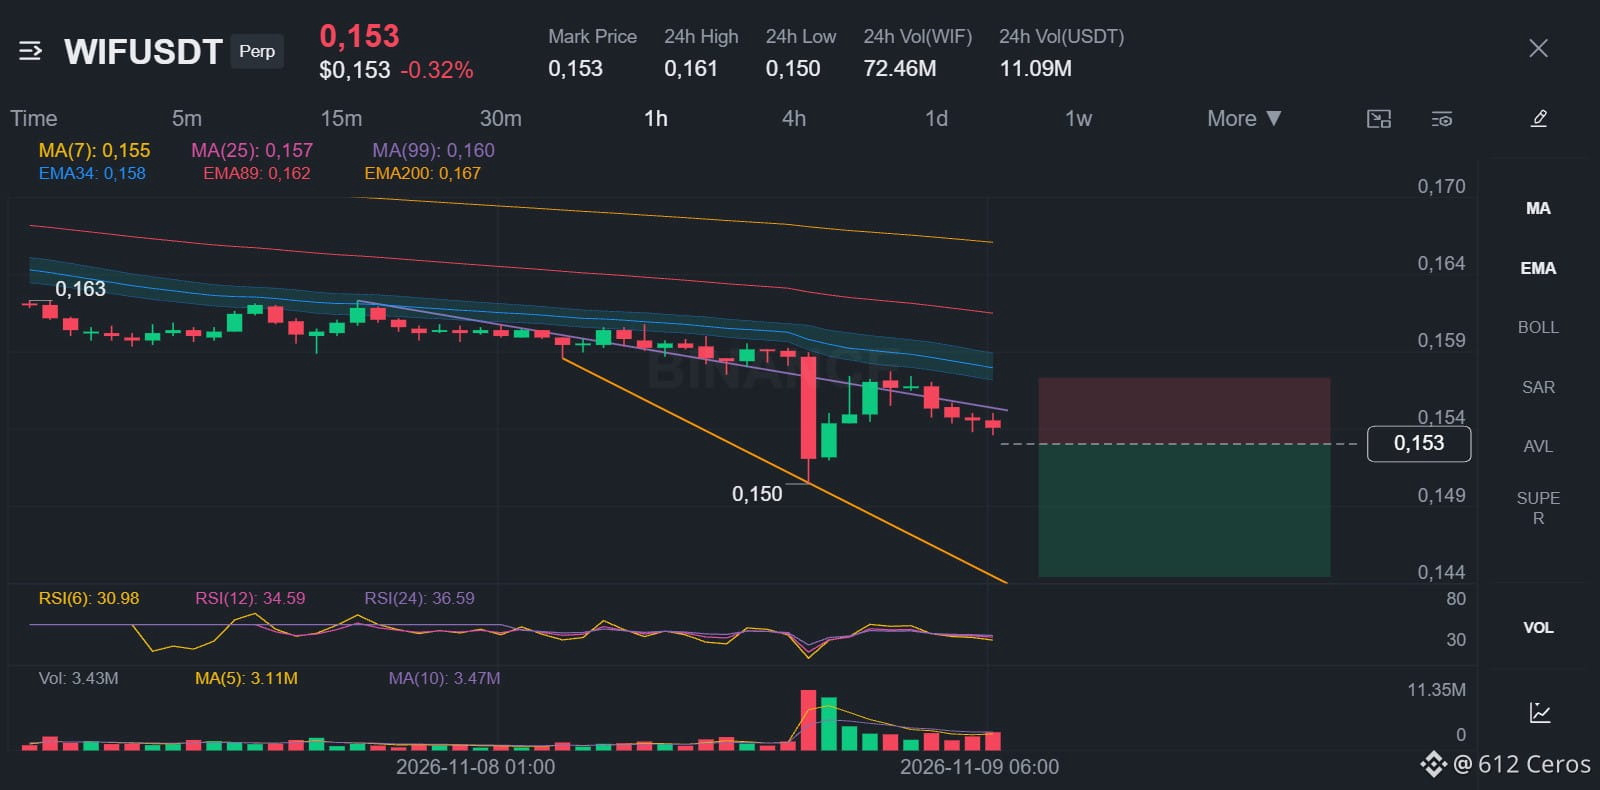
WIF price sits below EMA50 and EMA200 on the daily, 4h and 1h, so all trends point down.
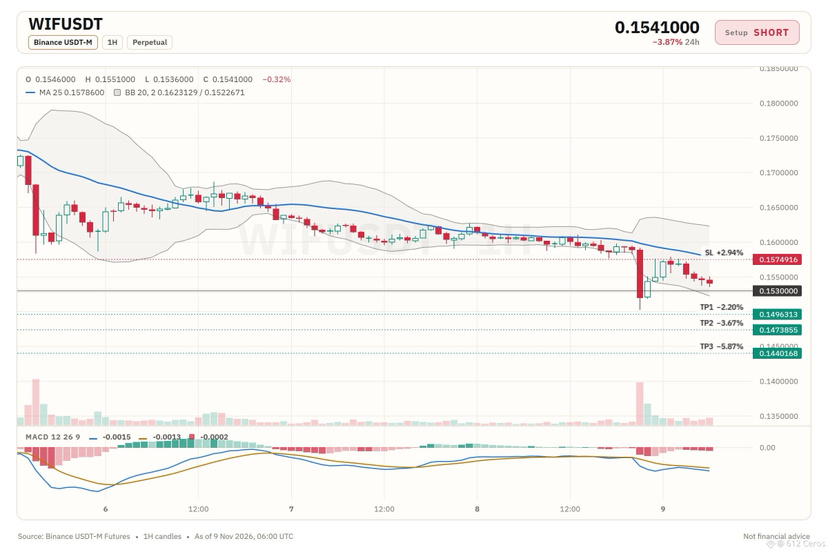
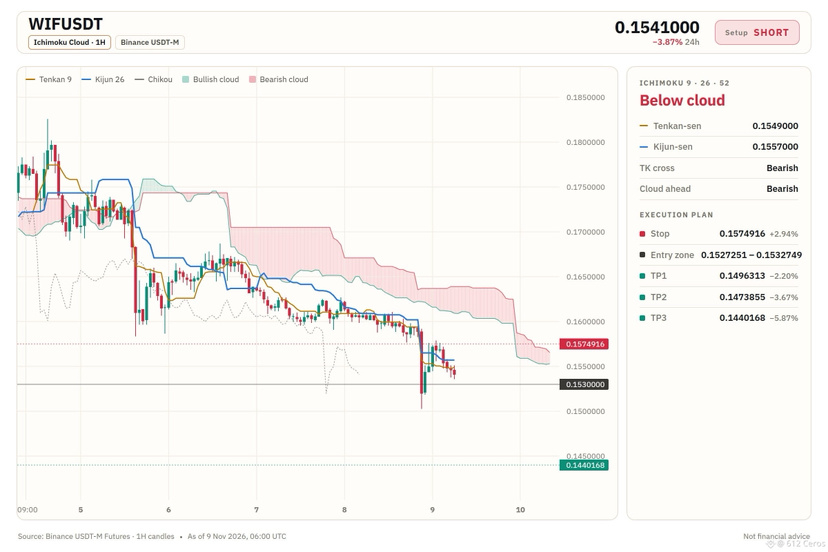
Entry: 0.1527251 – 0.1532749
TP1: 0.1496313 (-2.2%)
TP2: 0.1473855 (-3.7%)
TP3: 0.1440168 (-5.9%)
SL: 0.1574916 (+2.9%)
Why: The daily trend shows price below EMA50 and EMA200, which means the big-picture trend is bearish.
Risk: Far below its average, bounce likely (−3.4 ATR from 1h EMA50)
Plan: close 50% at TP1, 25% at TP2, 25% at TP3, and move the stop to entry after TP1.
Where do you see WIF finding its next bounce?
WIF price sits below EMA50 and EMA200 on the daily, 4h and 1h, so all trends point down.
Entry: 0.1527251 – 0.1532749
TP1: 0.1496313 (-2.2%)
TP2: 0.1473855 (-3.7%)
TP3: 0.1440168 (-5.9%)
SL: 0.1574916 (+2.9%)
Why: The daily trend shows price below EMA50 and EMA200, which means the big-picture trend is bearish.
Risk: Far below its average, bounce likely (−3.4 ATR from 1h EMA50)
Plan: close 50% at TP1, 25% at TP2, 25% at TP3, and move the stop to entry after TP1.
Where do you see WIF finding its next bounce?