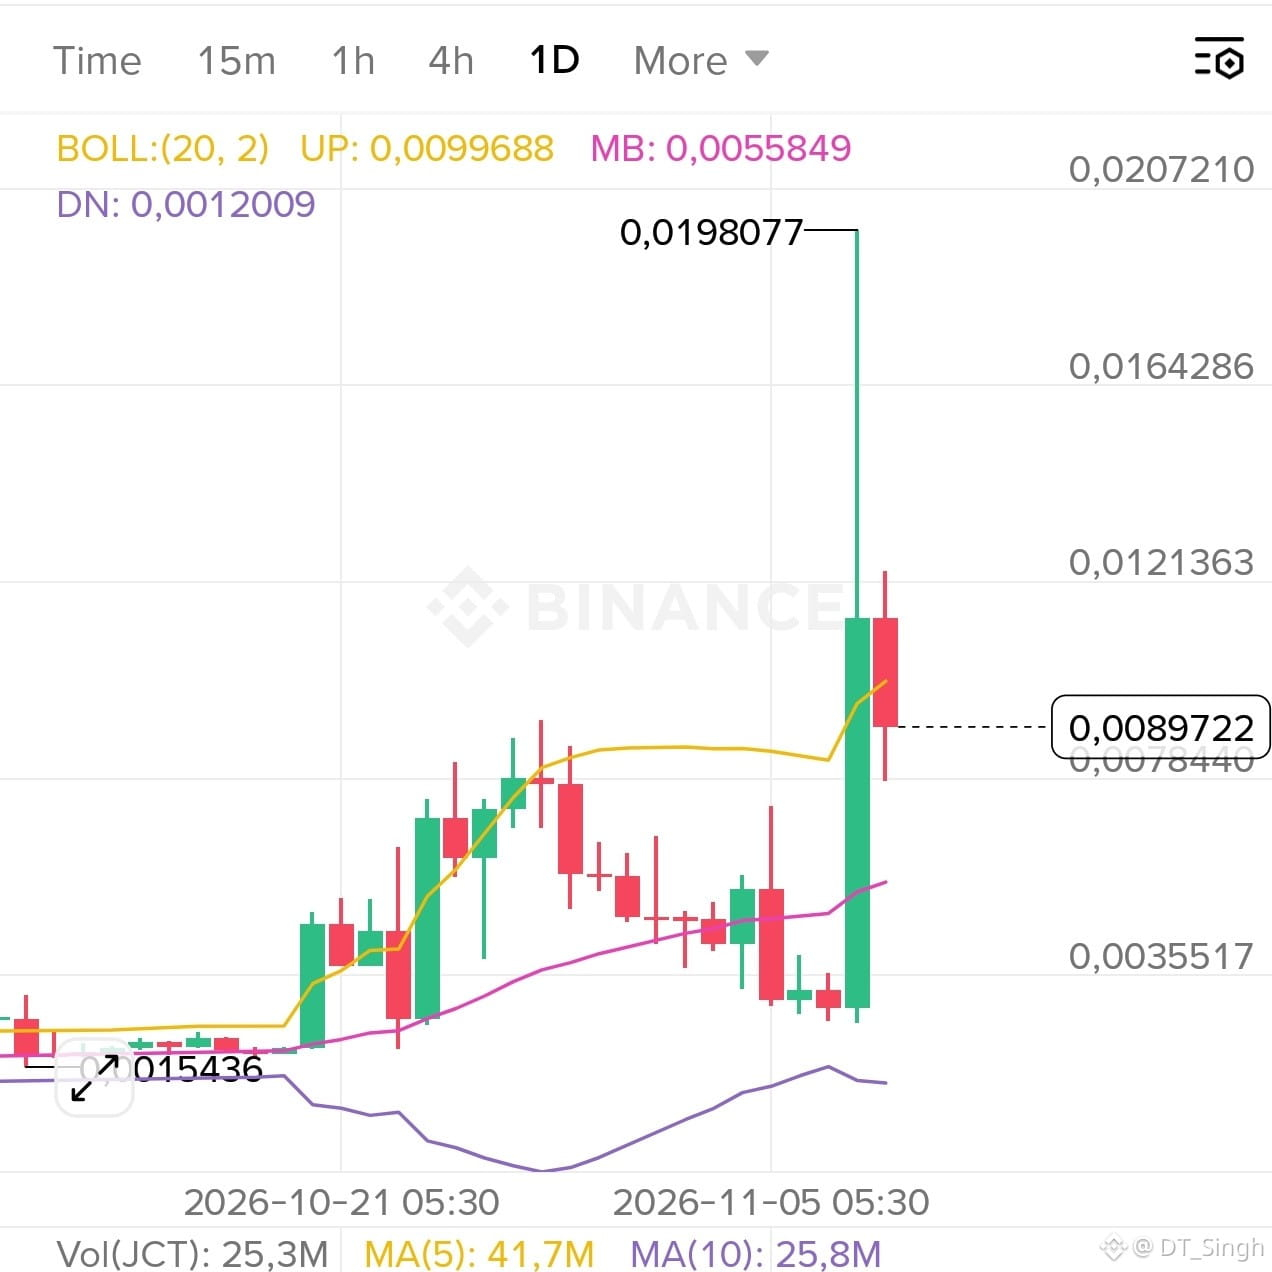

$JCT is up 223.70% in 24h and trading at $0.0089638 after a giant spike 🚀
The daily chart shows one huge green candle from about 0.0028 that wicked up to 0.0198, roughly 7x from the base. Today's candle is red so far, so part of the move is being given back
Chart levels I'm watching:
🔴 Resistance: 0.0100 (BOLL upper band), then 0.0114 – 0.0124 (yesterday's close and today's wick high)
🟢 Support: 0.0078 (today's low), then 0.0056 (BOLL midline)
🟡 Key level: 0.0028 (where the big candle started)
The spike came on heavy volume (about 129M, roughly 5x the 10-day average). Today's candle is still forming, with 25.3M traded so far.
From the header: market cap is $103.02M but FDV is $448.19M, so only about 23% of the total supply is circulating. On-chain liquidity is $1.43M, around 1.4% of market cap, so on-chain swaps can have high slippage. There are 16,898 holders.
A move back above 0.0124 would show buyers are in control again. Losing 0.0078 could open a deeper pullback toward 0.0056
Are you chasing this one, or waiting for the dust to settle? 👇
Chart-based observation only, not financial advice. NFA, manage your own risk
The daily chart shows one huge green candle from about 0.0028 that wicked up to 0.0198, roughly 7x from the base. Today's candle is red so far, so part of the move is being given back
Chart levels I'm watching:
🔴 Resistance: 0.0100 (BOLL upper band), then 0.0114 – 0.0124 (yesterday's close and today's wick high)
🟢 Support: 0.0078 (today's low), then 0.0056 (BOLL midline)
🟡 Key level: 0.0028 (where the big candle started)
The spike came on heavy volume (about 129M, roughly 5x the 10-day average). Today's candle is still forming, with 25.3M traded so far.
From the header: market cap is $103.02M but FDV is $448.19M, so only about 23% of the total supply is circulating. On-chain liquidity is $1.43M, around 1.4% of market cap, so on-chain swaps can have high slippage. There are 16,898 holders.
A move back above 0.0124 would show buyers are in control again. Losing 0.0078 could open a deeper pullback toward 0.0056
Are you chasing this one, or waiting for the dust to settle? 👇
Chart-based observation only, not financial advice. NFA, manage your own risk