🚨$ZEC : Is This the Beginning of a Recovery or Just Another Temporary Bounce?
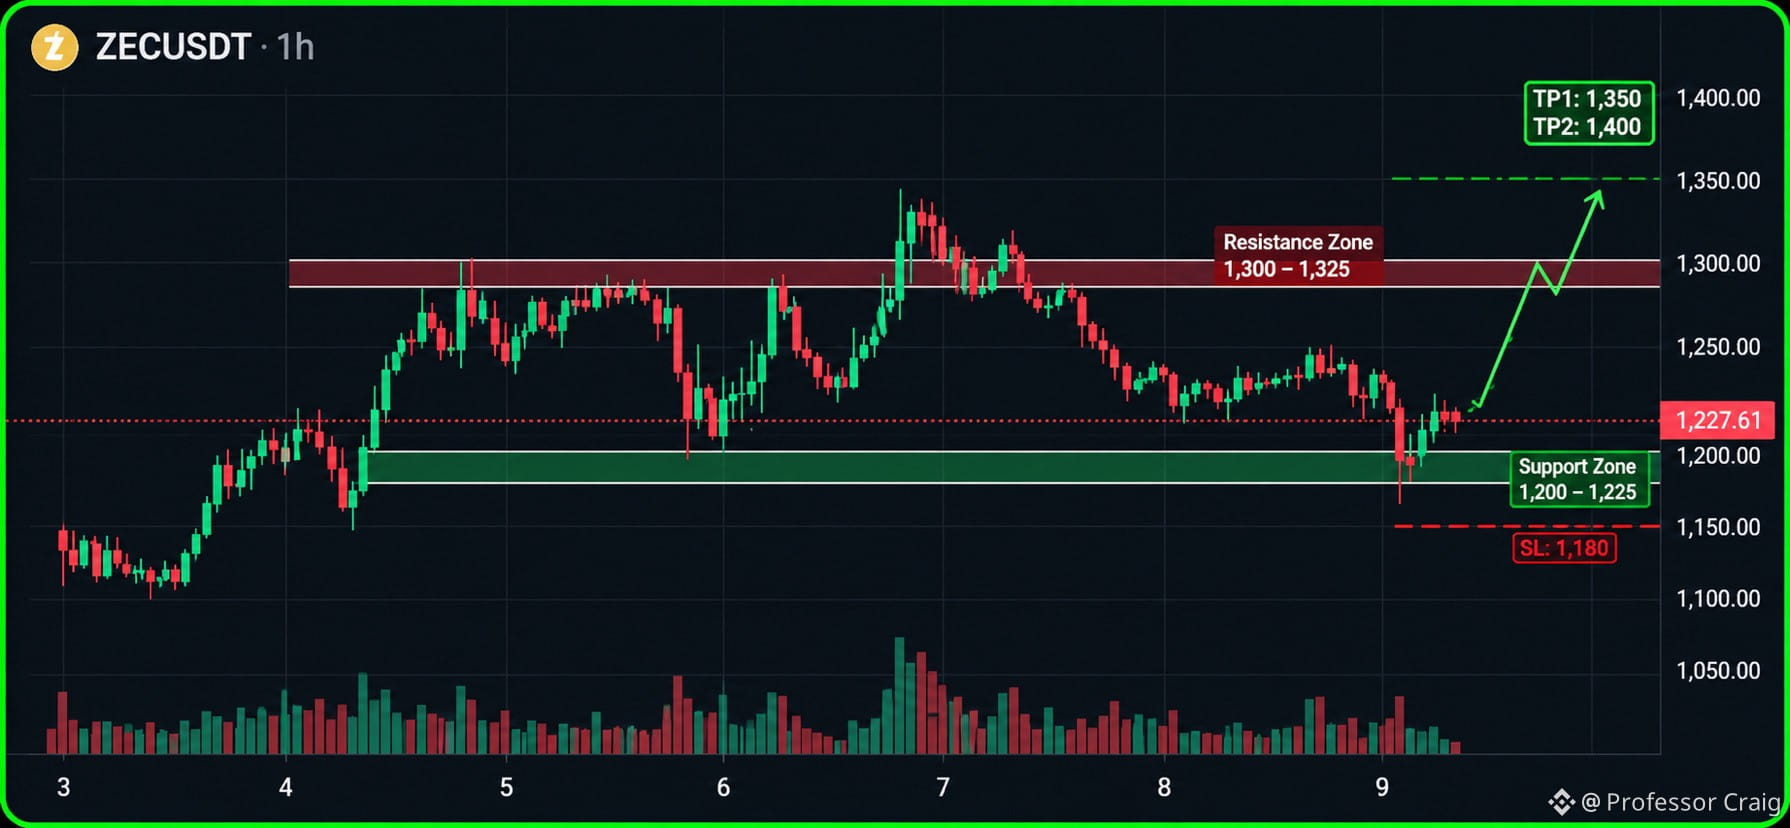
It is trading around $1,227 after facing considerable selling pressure over the last few sessions. Looking at the 1 hour chart, the structure shows that the previous bullish momentum has weakened significantly. After reaching the $1,370 area, it started forming lower highs and gradually losing ground. However, the latest price action is worth watching because buyers stepped in around the $1,177-$1,200 region and pushed it back above $1,220.
The most important area right now is the $1,200-$1,225 support zone. This region has attracted buying interest, and holding above it could give buyers another opportunity to build momentum. But one bounce is not enough to confirm a complete trend reversal. ZEC still needs to recover the $1,250 level and eventually challenge the $1,300-$1,325 resistance zone. A strong move above that resistance would improve the overall structure and could open the door toward $1,350 and potentially $1,400.
On the downside, losing $1,200 would be a serious warning sign. It could expose the previous low near $1,177, followed by the $1,150 area. That is why the current support deserves close attention. For now, ZEC is showing signs of a short-term recovery, but the broader 1 hour structure remains under pressure until buyers reclaim the important resistance levels.
The big question is whether buyers can turn this support into a proper recovery or sellers will push it toward another low. What is your target for ZEC this week?
Keep an eye on $PIEVERSE and $BEAT aswell guys.👀
#ZECUSDTAnalysis #zecusdt
It is trading around $1,227 after facing considerable selling pressure over the last few sessions. Looking at the 1 hour chart, the structure shows that the previous bullish momentum has weakened significantly. After reaching the $1,370 area, it started forming lower highs and gradually losing ground. However, the latest price action is worth watching because buyers stepped in around the $1,177-$1,200 region and pushed it back above $1,220.
The most important area right now is the $1,200-$1,225 support zone. This region has attracted buying interest, and holding above it could give buyers another opportunity to build momentum. But one bounce is not enough to confirm a complete trend reversal. ZEC still needs to recover the $1,250 level and eventually challenge the $1,300-$1,325 resistance zone. A strong move above that resistance would improve the overall structure and could open the door toward $1,350 and potentially $1,400.
On the downside, losing $1,200 would be a serious warning sign. It could expose the previous low near $1,177, followed by the $1,150 area. That is why the current support deserves close attention. For now, ZEC is showing signs of a short-term recovery, but the broader 1 hour structure remains under pressure until buyers reclaim the important resistance levels.
The big question is whether buyers can turn this support into a proper recovery or sellers will push it toward another low. What is your target for ZEC this week?
Keep an eye on $PIEVERSE and $BEAT aswell guys.👀
#ZECUSDTAnalysis #zecusdt