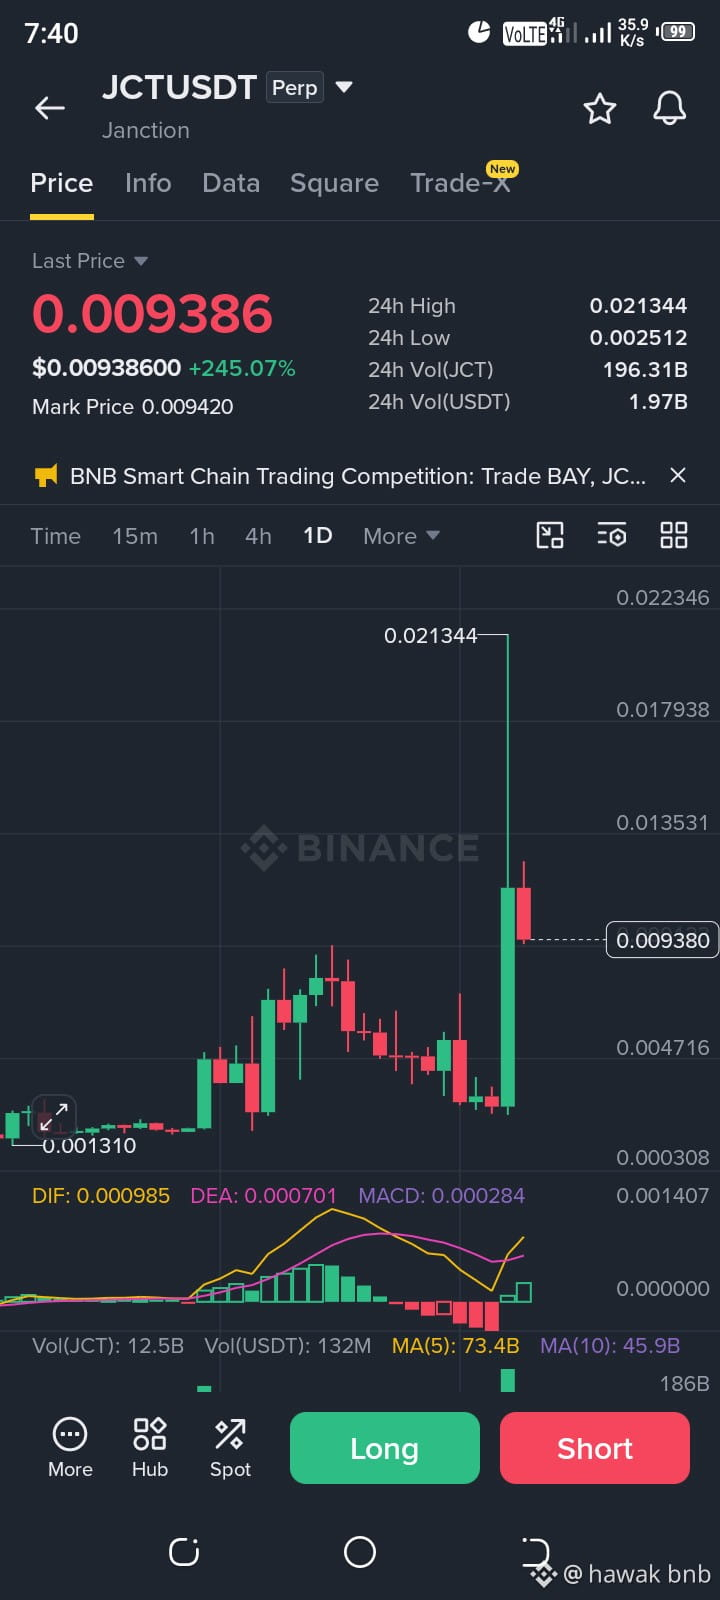
Price and Performance: The current price is 0.009386, reflecting a massive surge of +245.07% over the past 24 hours.
High and Low: During the last 24 hours, the token reached a high of 0.021344 and a low of 0.002512.
Trend and Momentum: The chart shows a sharp upward pump from 0.001310 up to 0.021344, following which the price is currently experiencing a retracement (correction) phase, forming a red candle.
Volume: There is heavy liquidity and trading activity in the market, with a 24-hour trading volume of 196.31B JCT and 1.97B USDT.
Indicators: On the MACD indicator, the DIF is above the DEA in the positive zone, but the histogram momentum is slowing down, which may signal a short-term sideways movement or further correction. @JCT #JCT $JCT #BitcoinFiveWeeklyLosses #AIChipSlumpNasdaq #BinanceReopensWithdrawalsForHYPE&APT #TradFiForBeginners
High and Low: During the last 24 hours, the token reached a high of 0.021344 and a low of 0.002512.
Trend and Momentum: The chart shows a sharp upward pump from 0.001310 up to 0.021344, following which the price is currently experiencing a retracement (correction) phase, forming a red candle.
Volume: There is heavy liquidity and trading activity in the market, with a 24-hour trading volume of 196.31B JCT and 1.97B USDT.
Indicators: On the MACD indicator, the DIF is above the DEA in the positive zone, but the histogram momentum is slowing down, which may signal a short-term sideways movement or further correction. @JCT #JCT $JCT #BitcoinFiveWeeklyLosses #AIChipSlumpNasdaq #BinanceReopensWithdrawalsForHYPE&APT #TradFiForBeginners