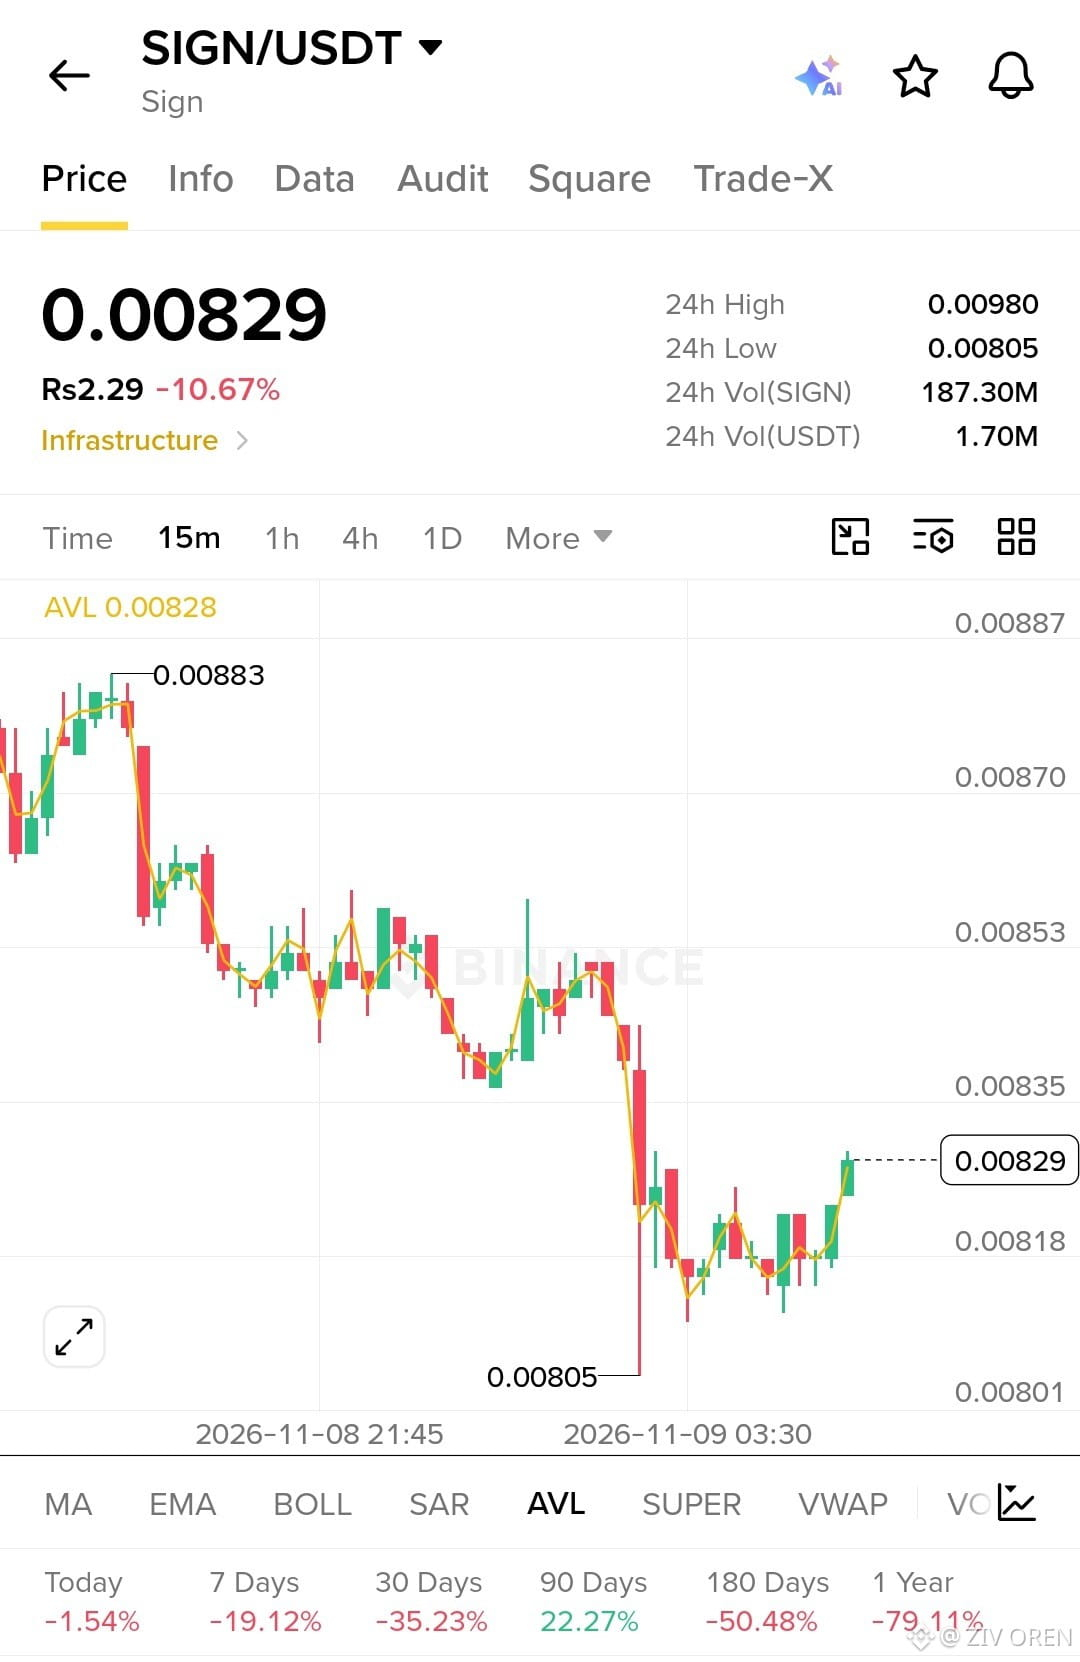

$SIGN IS SHOWING BUYER INTEREST AFTER A SHARP DROP! CAN THE RECOVERY CONTINUE?
I'm watching Sign ($SIGN ) closely on the 15M chart. Price is currently trading around $0.00829, down 10.67% over 24 hours.
The chart has been in a clear short-term downtrend, falling from the $0.00883 high toward $0.00805. However, buyers have stepped in near the lows, and price is now attempting a short-term recovery.
Key Market Levels:
- Current Price: $0.00829
- Immediate Support: $0.00818
- Major Support: $0.00805
- Immediate Resistance: $0.00835
- Next Resistance: $0.00853
- Major Resistance: $0.00870
Volume & Market Participation:
24H Trading Volume: $1.70M
24H SIGN Volume: 187.30M
Despite the recent selling pressure, the latest bounce suggests buyers are trying to regain control. However, stronger buying volume is needed to confirm a reversal.
My Trading Plan:
I'm watching the $0.00818–$0.00805 zone for a potential spot accumulation opportunity.
If SIGN holds this support and reclaims $0.00835 with strong momentum, I'll look for a move toward $0.00853 and potentially $0.00870.
A breakdown below $0.00805 would invalidate my bullish recovery idea.
My Take:
I'm not calling this a confirmed reversal yet. I want to see buyers defend support and break the nearby resistance before adding exposure.
The next move around $0.00835 could determine whether $SIGN starts building a stronger recovery or remains under bearish pressure.
I'm watching Sign ($SIGN ) closely on the 15M chart. Price is currently trading around $0.00829, down 10.67% over 24 hours.
The chart has been in a clear short-term downtrend, falling from the $0.00883 high toward $0.00805. However, buyers have stepped in near the lows, and price is now attempting a short-term recovery.
Key Market Levels:
- Current Price: $0.00829
- Immediate Support: $0.00818
- Major Support: $0.00805
- Immediate Resistance: $0.00835
- Next Resistance: $0.00853
- Major Resistance: $0.00870
Volume & Market Participation:
24H Trading Volume: $1.70M
24H SIGN Volume: 187.30M
Despite the recent selling pressure, the latest bounce suggests buyers are trying to regain control. However, stronger buying volume is needed to confirm a reversal.
My Trading Plan:
I'm watching the $0.00818–$0.00805 zone for a potential spot accumulation opportunity.
If SIGN holds this support and reclaims $0.00835 with strong momentum, I'll look for a move toward $0.00853 and potentially $0.00870.
A breakdown below $0.00805 would invalidate my bullish recovery idea.
My Take:
I'm not calling this a confirmed reversal yet. I want to see buyers defend support and break the nearby resistance before adding exposure.
The next move around $0.00835 could determine whether $SIGN starts building a stronger recovery or remains under bearish pressure.