🚨 $BTC : A MASSIVE $8 BILLION LIQUIDATION BATTLE IS DEVELOPING!
Bitcoin's liquidation map is showing an interesting imbalance between the upside and downside liquidity zones.
Let's break it down.
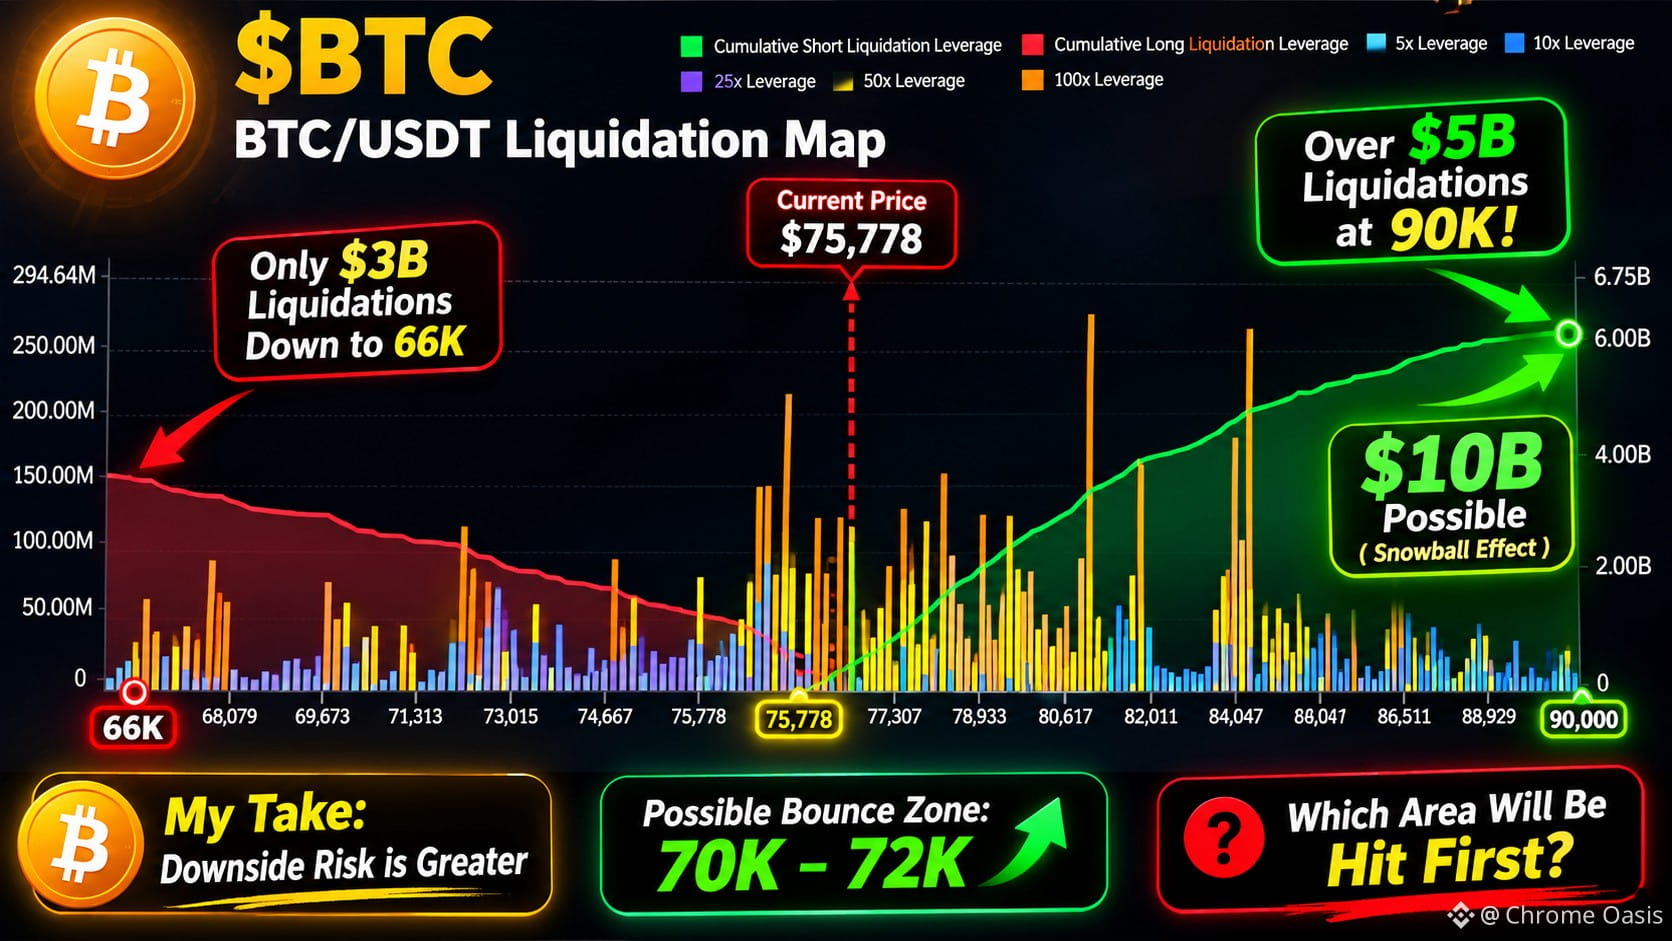
🔺 Upside Scenario: $90K
If the major long-side liquidity clusters build toward the $90K region, more than $5 billion in liquidations could be triggered. With additional forced liquidations creating a snowball effect, the total could potentially approach $10 billion.
🔻 Downside Scenario: $66K
Looking below the current price, approximately $3 billion in liquidation exposure appears to be sitting around the $66K region. That's still a substantial amount of liquidity, but noticeably less than the potential upside concentration.
My Take:
Despite the larger liquidity pool above, I currently see greater downside risk. My expectation is that Bitcoin could continue moving lower before finding meaningful buying interest around $70K–$72K.
However, liquidation levels are not guaranteed price targets. The market can change direction quickly as liquidity shifts.
👀 The big question: Will $BTC hunt liquidity above $90K first, or sweep the downside toward $70K?
Share your prediction below!
DYOR. #Bitcoin #BTC #CryptoTrading #LiquidationMap #CryptoMarket
Bitcoin's liquidation map is showing an interesting imbalance between the upside and downside liquidity zones.
Let's break it down.
🔺 Upside Scenario: $90K
If the major long-side liquidity clusters build toward the $90K region, more than $5 billion in liquidations could be triggered. With additional forced liquidations creating a snowball effect, the total could potentially approach $10 billion.
🔻 Downside Scenario: $66K
Looking below the current price, approximately $3 billion in liquidation exposure appears to be sitting around the $66K region. That's still a substantial amount of liquidity, but noticeably less than the potential upside concentration.
My Take:
Despite the larger liquidity pool above, I currently see greater downside risk. My expectation is that Bitcoin could continue moving lower before finding meaningful buying interest around $70K–$72K.
However, liquidation levels are not guaranteed price targets. The market can change direction quickly as liquidity shifts.
👀 The big question: Will $BTC hunt liquidity above $90K first, or sweep the downside toward $70K?
Share your prediction below!
DYOR. #Bitcoin #BTC #CryptoTrading #LiquidationMap #CryptoMarket