Technical Chart Setup (EMA Confluence & Confirmation)
Why waiting for candle closes beats front-running chart breakouts 🕯️📊
One of the most frequent traps for swing traders is jumping into an EMA cross before the candle actually closes.
Here is why patience around confluence levels matters:
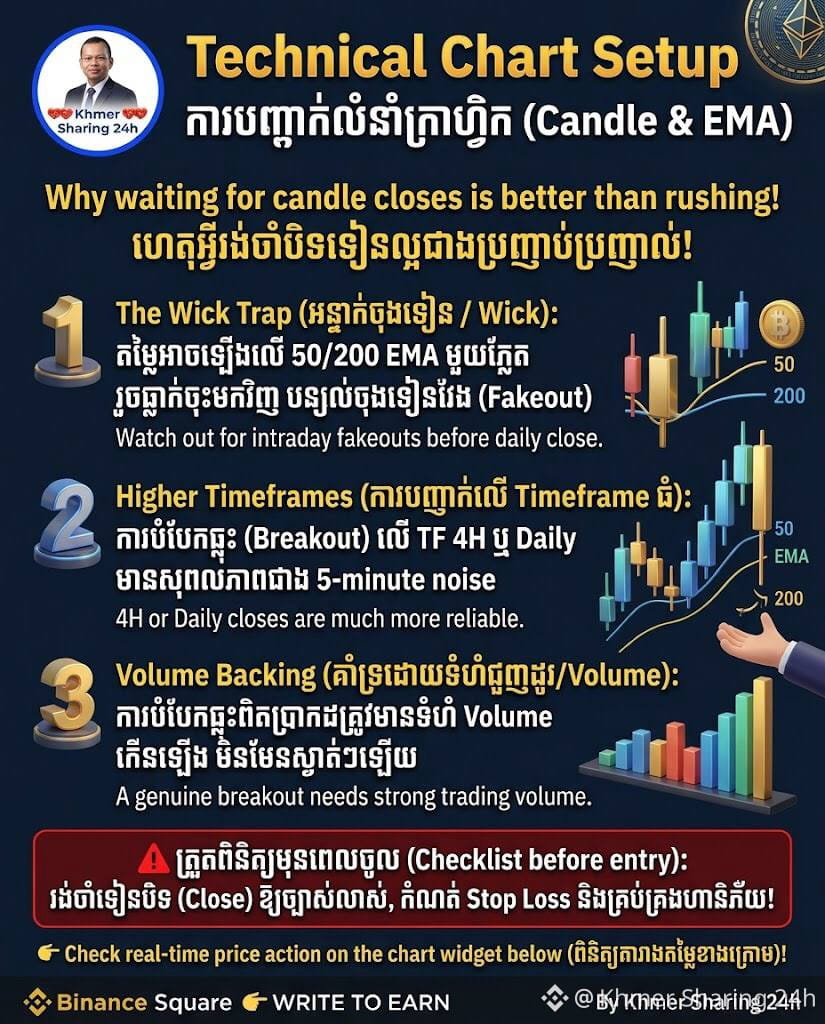
The Wick Trap: Price can spike above the 50 EMA or 200 EMA intraday, only to reject and leave a long upper wick by the daily close. Entering early turns a potential fakeout into an immediate loss.
Higher Timeframe Confirmation: An EMA breakout carries far greater reliability on the 4-Hour or Daily timeframe than on lower 5-minute noise.
Volume Backing: A genuine breakout through key dynamic resistance should be supported by an uptick in volume. Low volume into major moving averages often signals exhaustion.
⚠️ Checklist before entry: Wait for candle close confirmation, verify invalidation levels below structure, and keep sizing aligned with your risk tolerance.
👇 Check real-time price action on the chart widget below:
(Insert BTC orETH Coin Widget here)
Which timeframe do you trust most for trend confirmation: 1-Hour, 4-Hour, or Daily? Drop your view below! 💬
@Binance Square Official @Binance Khmer
#Write2Earn #TechnicalAnalysis #ChartPatterns #TradingDiscipline #KhmerSharing24h
Why waiting for candle closes beats front-running chart breakouts 🕯️📊
One of the most frequent traps for swing traders is jumping into an EMA cross before the candle actually closes.
Here is why patience around confluence levels matters:
The Wick Trap: Price can spike above the 50 EMA or 200 EMA intraday, only to reject and leave a long upper wick by the daily close. Entering early turns a potential fakeout into an immediate loss.
Higher Timeframe Confirmation: An EMA breakout carries far greater reliability on the 4-Hour or Daily timeframe than on lower 5-minute noise.
Volume Backing: A genuine breakout through key dynamic resistance should be supported by an uptick in volume. Low volume into major moving averages often signals exhaustion.
⚠️ Checklist before entry: Wait for candle close confirmation, verify invalidation levels below structure, and keep sizing aligned with your risk tolerance.
👇 Check real-time price action on the chart widget below:
(Insert BTC orETH Coin Widget here)
Which timeframe do you trust most for trend confirmation: 1-Hour, 4-Hour, or Daily? Drop your view below! 💬
@Binance Square Official @Binance Khmer
#Write2Earn #TechnicalAnalysis #ChartPatterns #TradingDiscipline #KhmerSharing24h