$TRUMP Is 88% Below Its 1-Year High. Value Zone or Falling Knife?
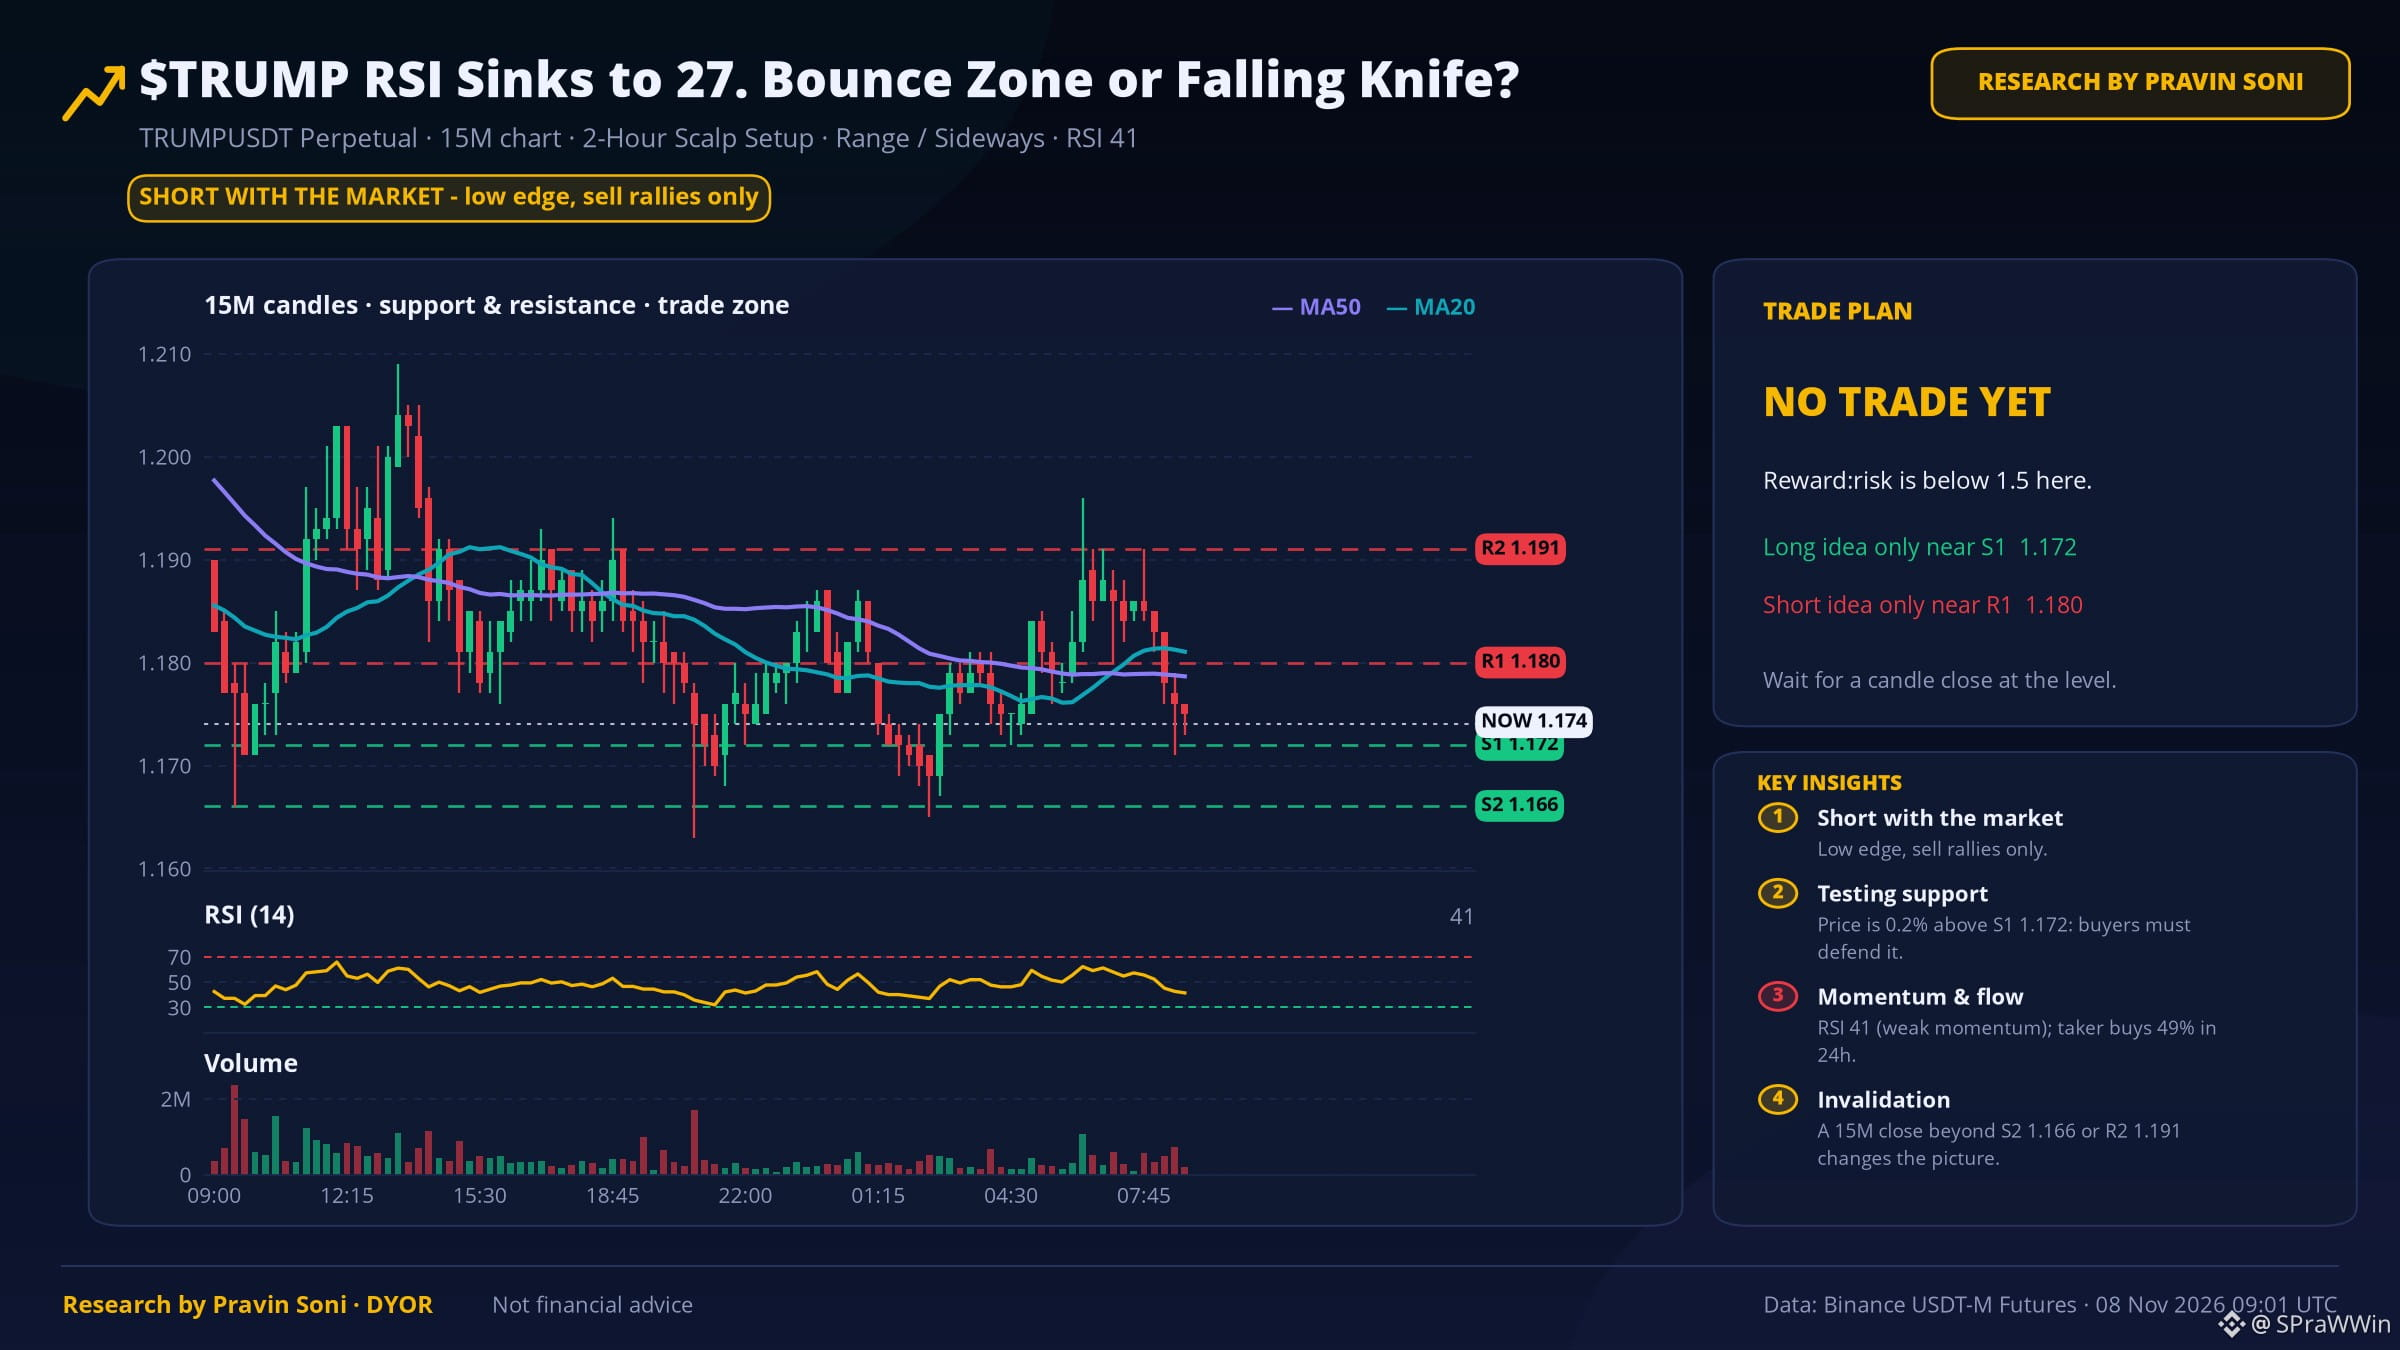
TL;DR: RSI 27: oversold on the daily; 88% below its 1-year high. History leans up (5/8). Price 1.173, daily RSI 27.
📌 Key data points
1️⃣ Daily RSI is 27 — oversold. That flags a stretched move, not an exact top/bottom.
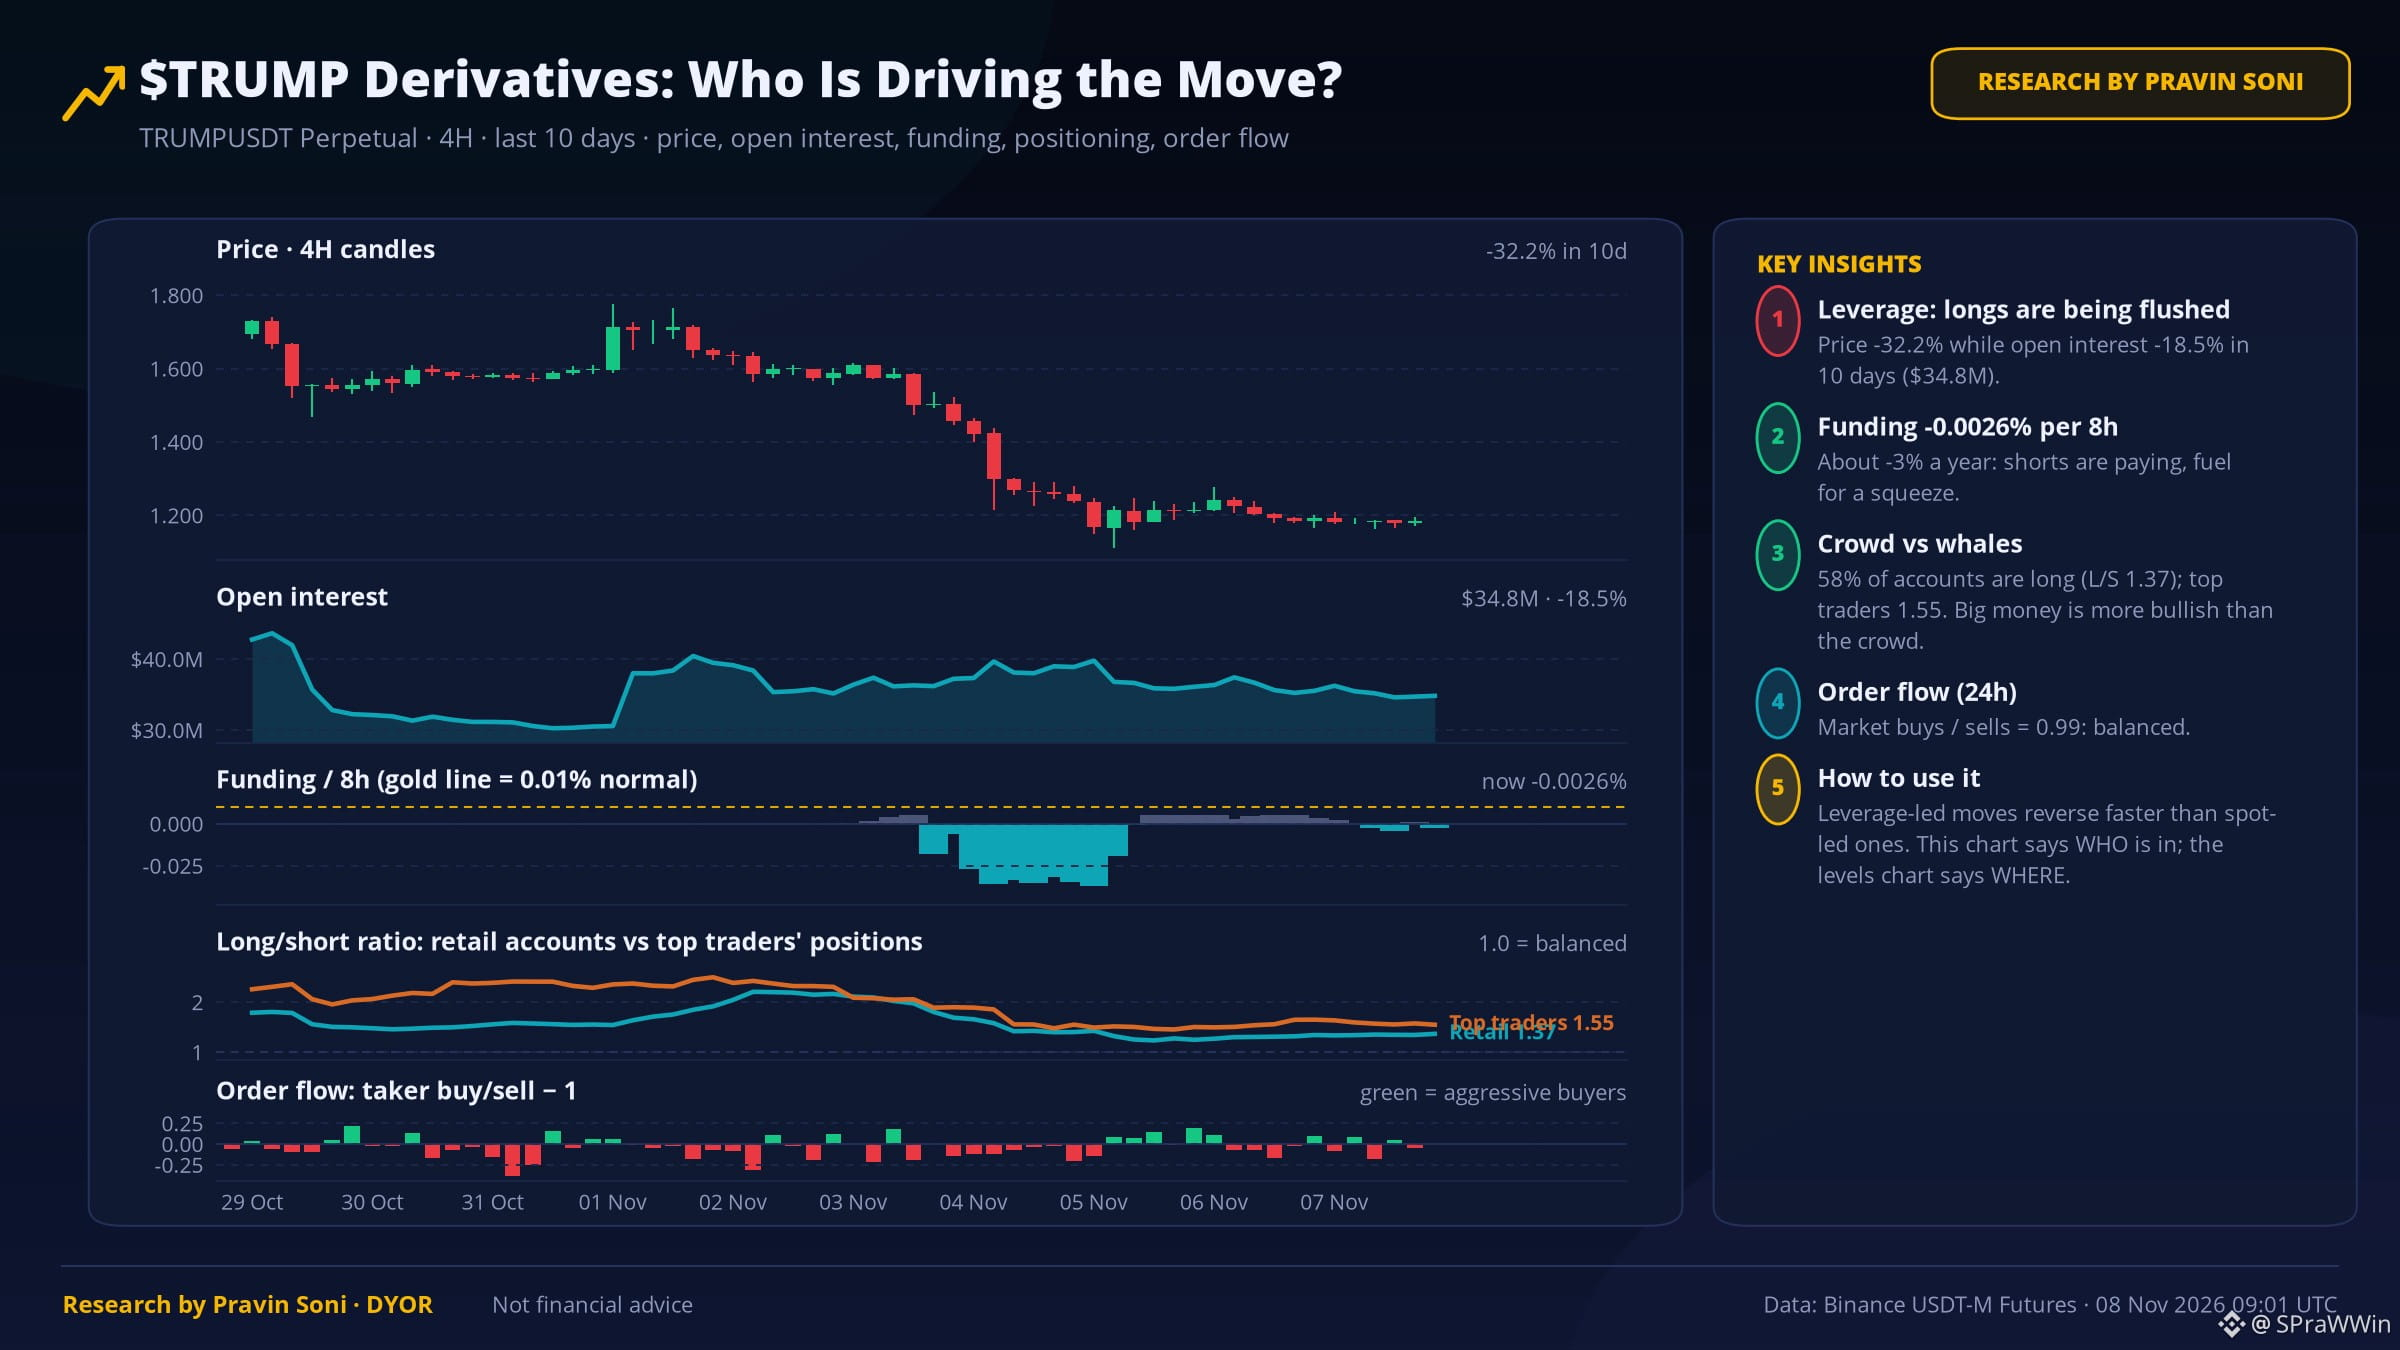
2️⃣ Still 88% below its 1-year high — deep drawdown; rallies may meet supply.
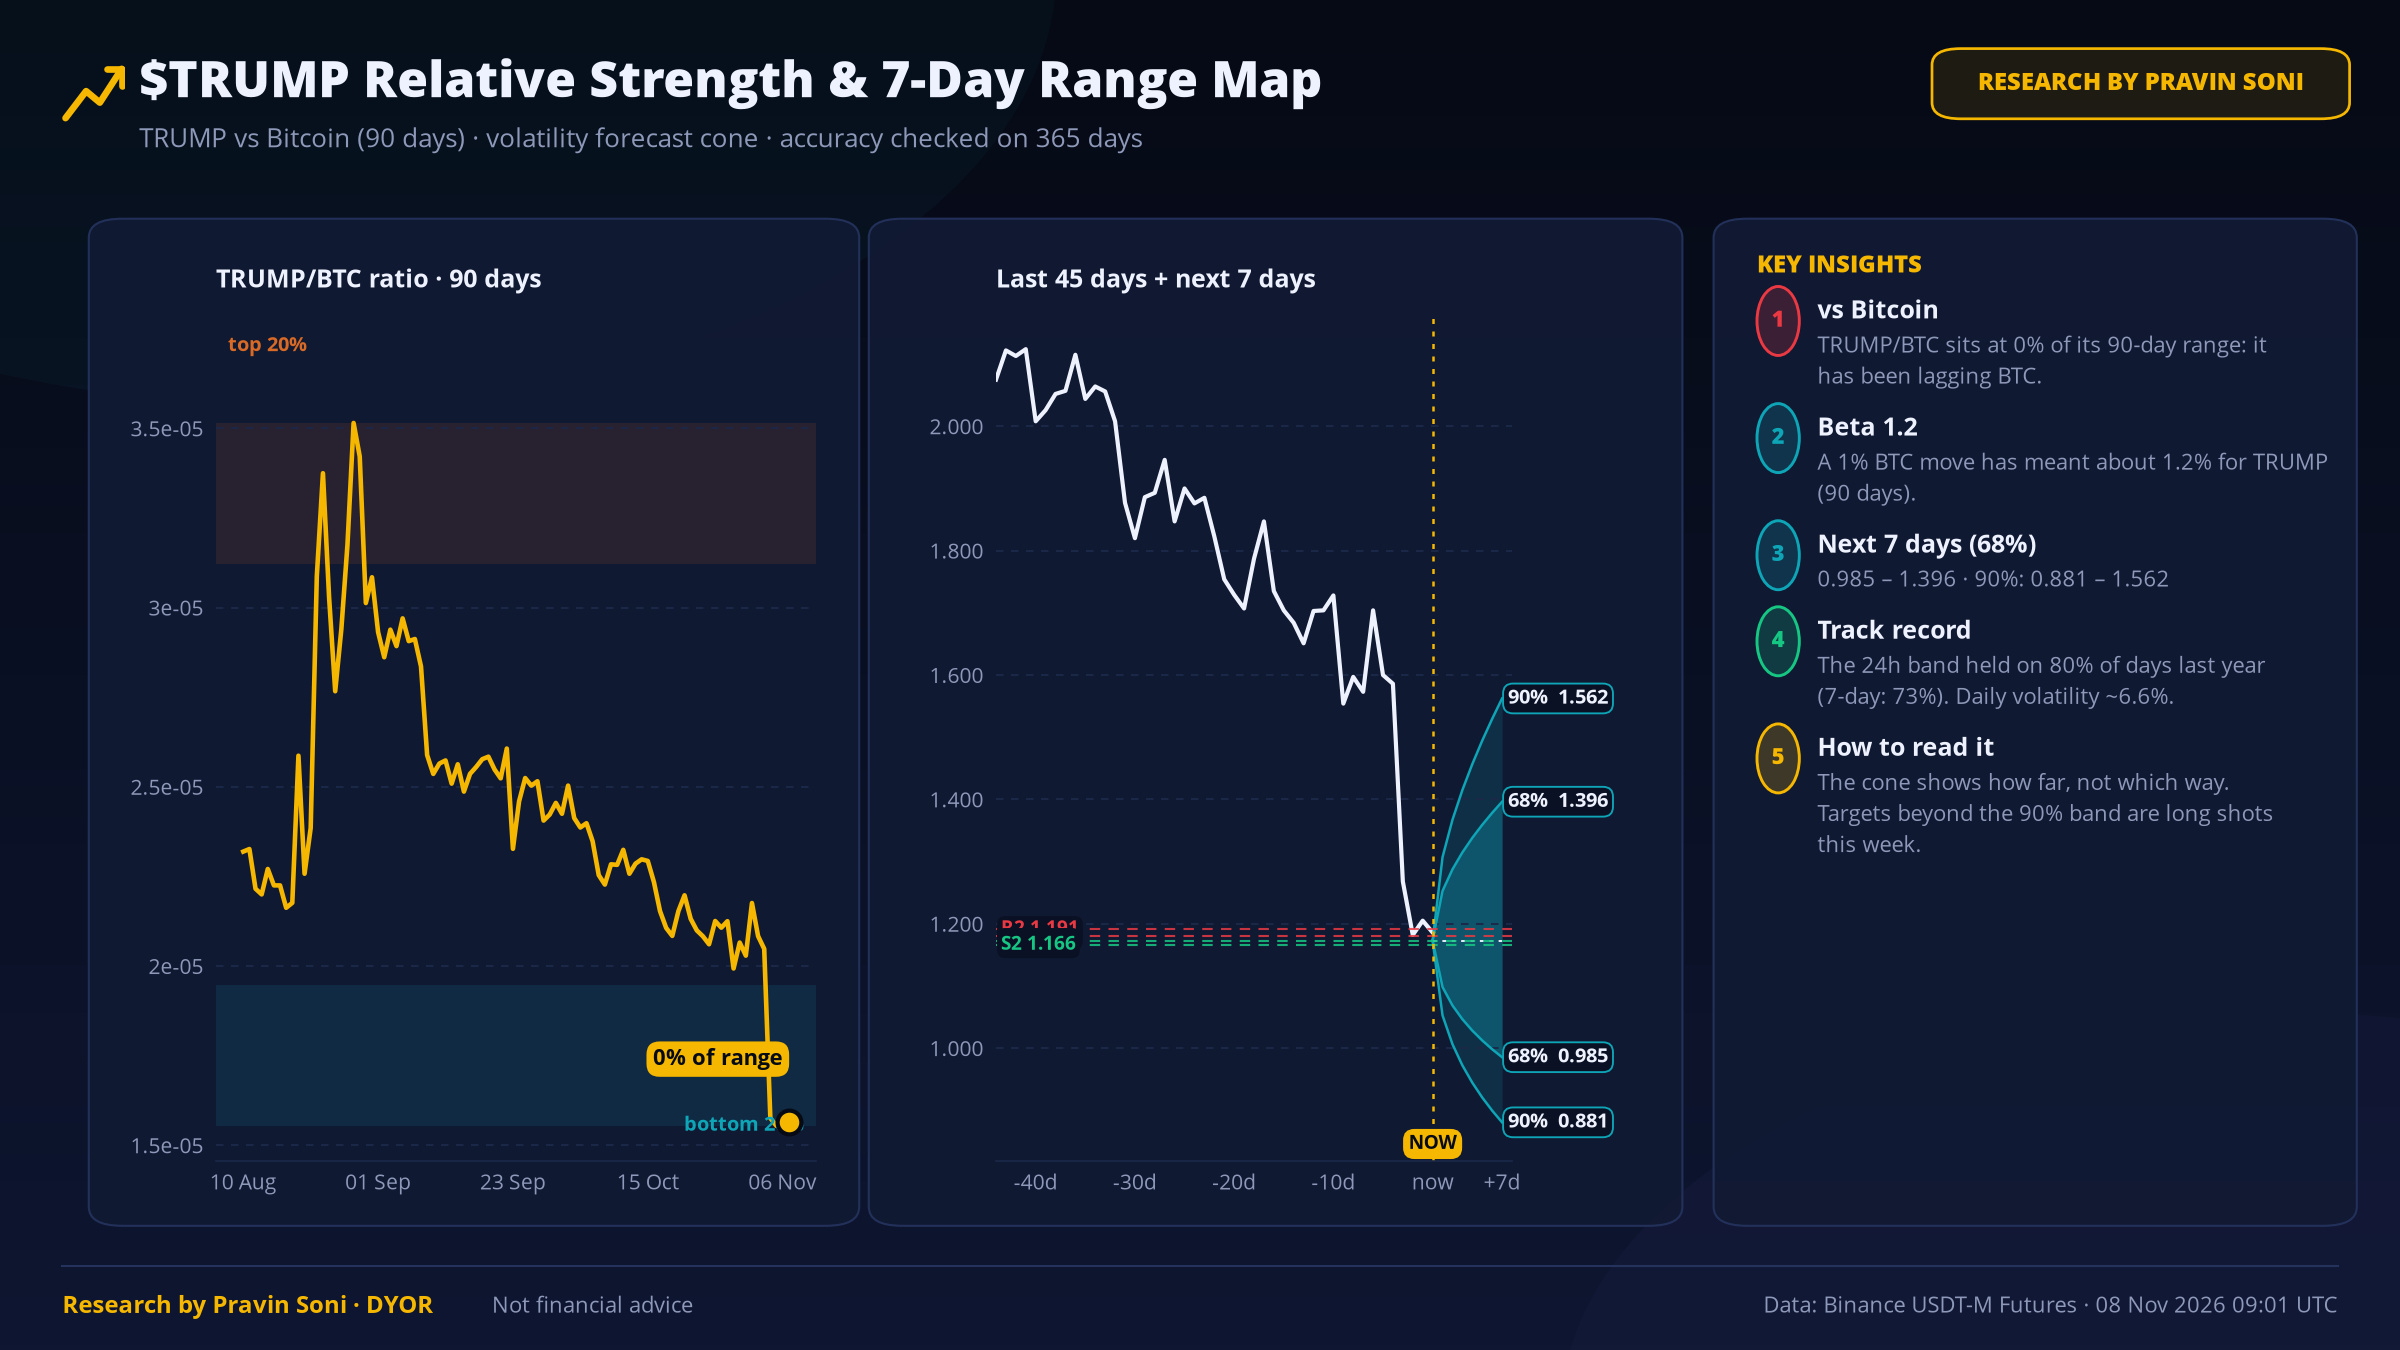
3️⃣ Over 30 days it is trailing $BTC by 28.4 points (7D: -23.3).
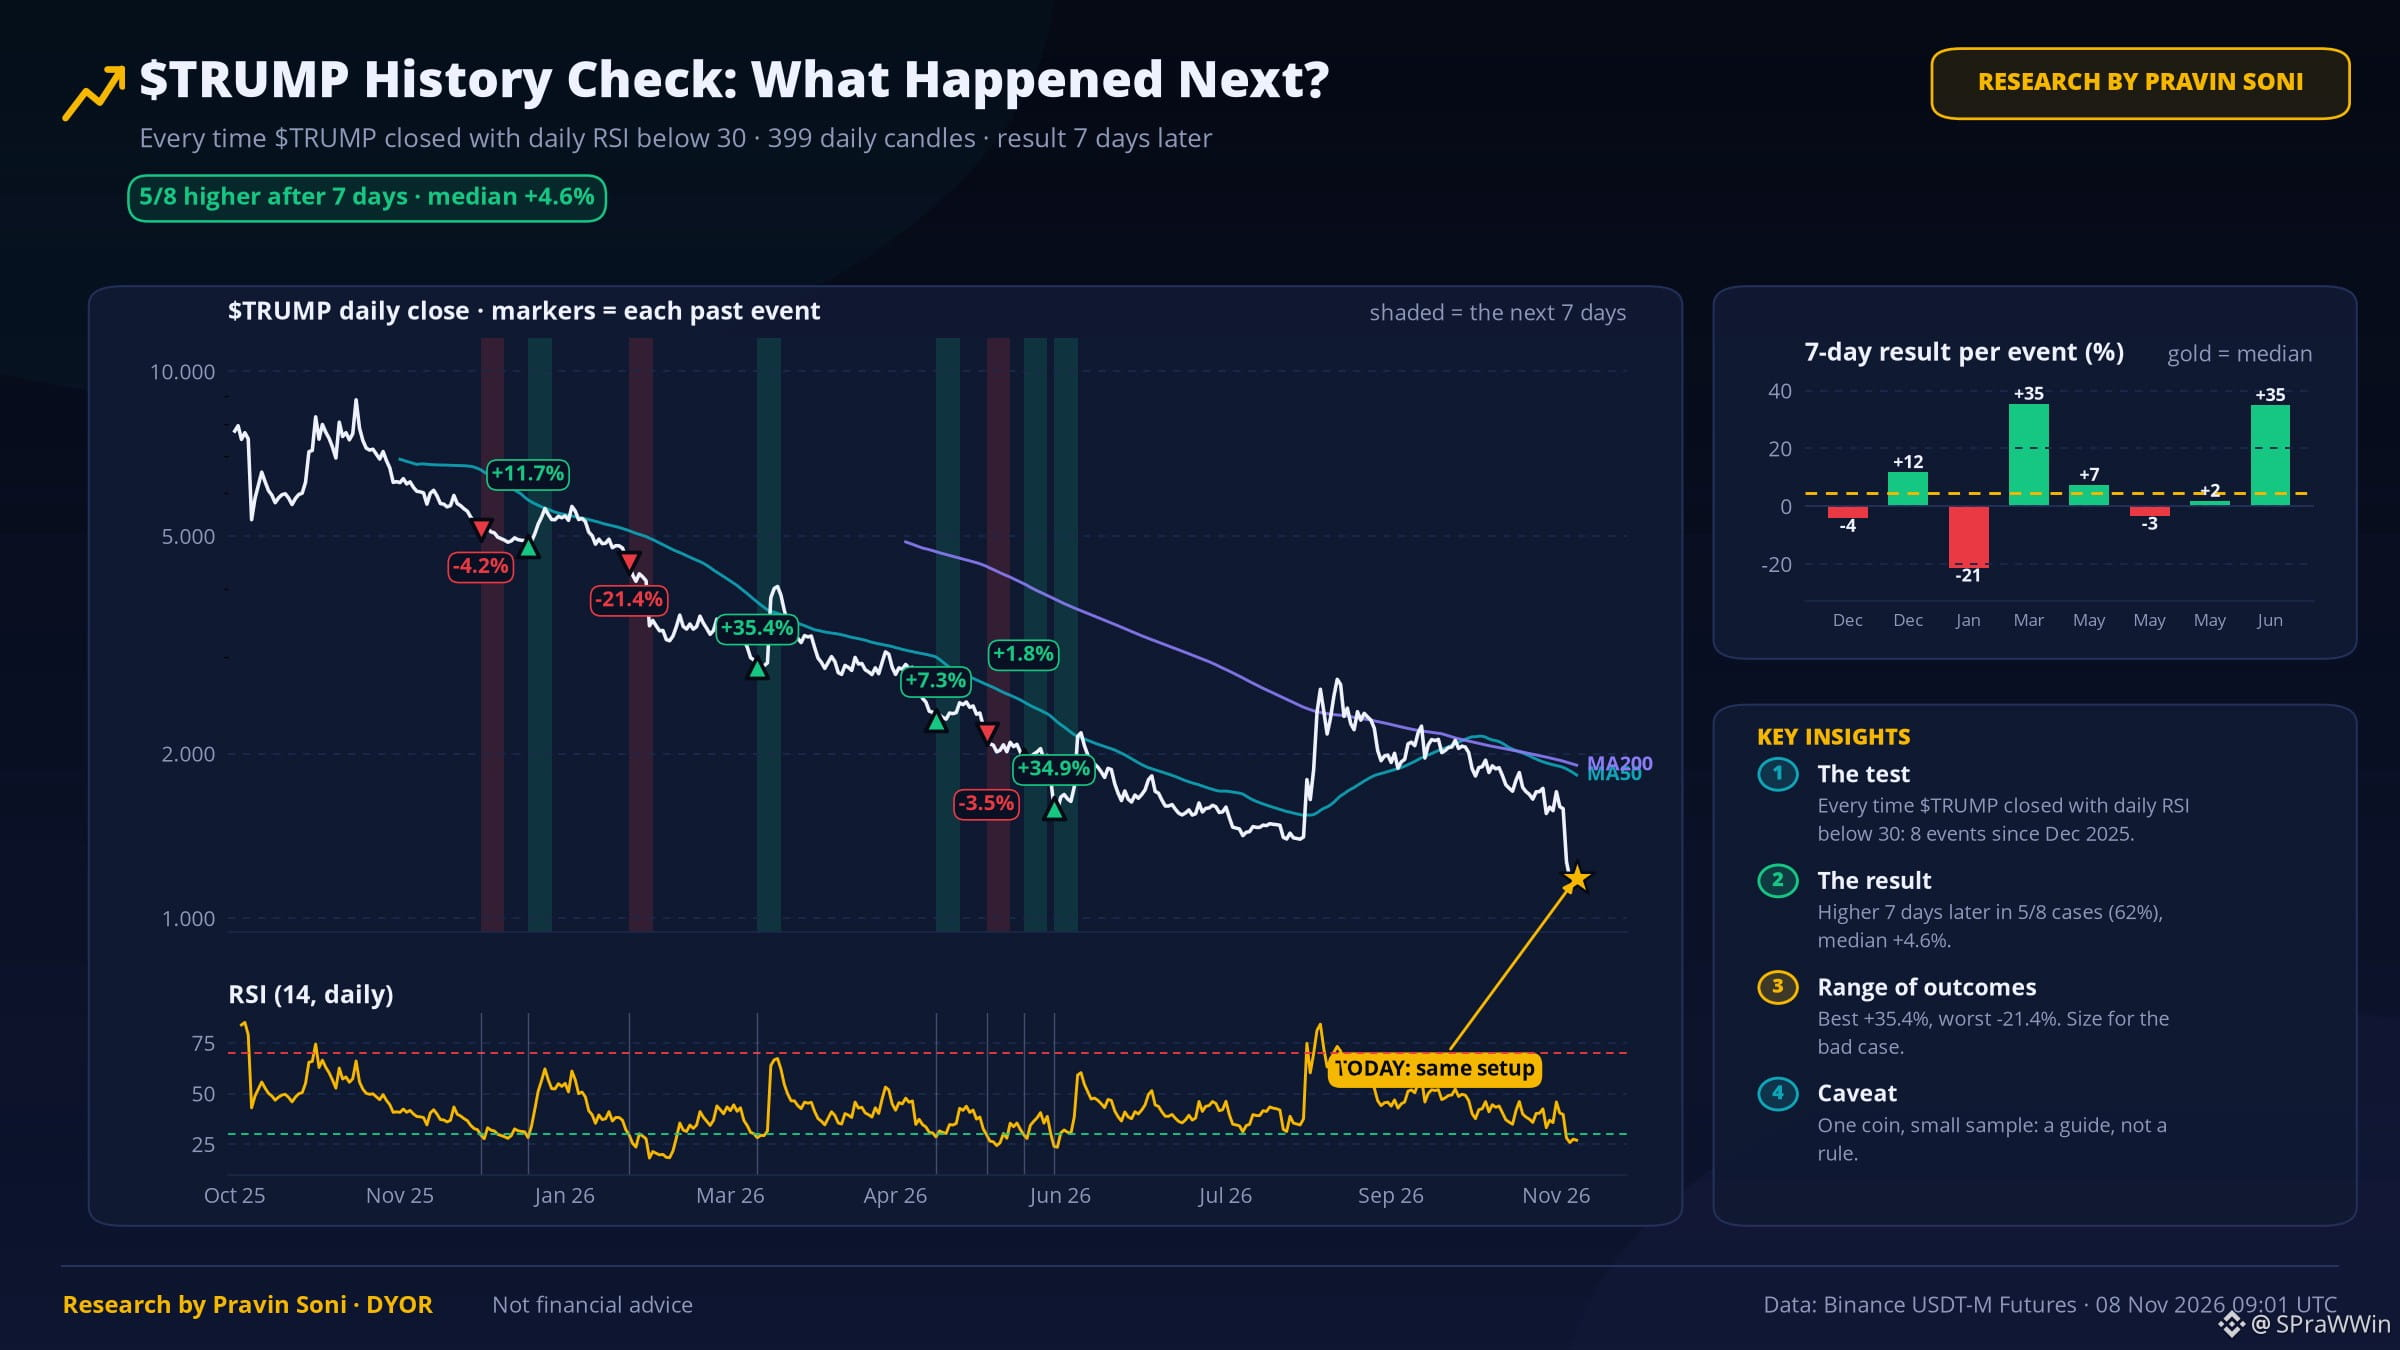
🔁 Same setup, past results
The last 8 times $TRUMP closed with daily RSI below 30, it was higher 7 days later in 5 of 8 cases (median +4.6%). Small sample, so a guide, not a rule.
📏 Volatility map (7 days)
68% band: 0.985 – 1.396 · 90% band: 0.881 – 1.562
This band held on 80% of days last year. It shows how far, not which way.
vs $BTC: TRUMP/BTC sits at 0% of its 90-day range, beta 1.2.
🧭 Key levels to watch
🟢 Bull case: daily close above 1.180 → 1.191
🔴 Bear case: daily close below 1.172 → 1.166
💡 How I see it: The data leans bearish. A daily close below 1.172 confirms it; reclaiming 1.180 proves me wrong.
💬 Would you trade this, or sit it out?
Not financial advice · Data: Binance Futures
$TRUMP #TRUMP #RSI #CryptoAnalysis
⚠️ Research by Pravin Soni - DYOR
TL;DR: RSI 27: oversold on the daily; 88% below its 1-year high. History leans up (5/8). Price 1.173, daily RSI 27.
📌 Key data points
1️⃣ Daily RSI is 27 — oversold. That flags a stretched move, not an exact top/bottom.
2️⃣ Still 88% below its 1-year high — deep drawdown; rallies may meet supply.
3️⃣ Over 30 days it is trailing $BTC by 28.4 points (7D: -23.3).
🔁 Same setup, past results
The last 8 times $TRUMP closed with daily RSI below 30, it was higher 7 days later in 5 of 8 cases (median +4.6%). Small sample, so a guide, not a rule.
📏 Volatility map (7 days)
68% band: 0.985 – 1.396 · 90% band: 0.881 – 1.562
This band held on 80% of days last year. It shows how far, not which way.
vs $BTC: TRUMP/BTC sits at 0% of its 90-day range, beta 1.2.
🧭 Key levels to watch
🟢 Bull case: daily close above 1.180 → 1.191
🔴 Bear case: daily close below 1.172 → 1.166
💡 How I see it: The data leans bearish. A daily close below 1.172 confirms it; reclaiming 1.180 proves me wrong.
💬 Would you trade this, or sit it out?
Not financial advice · Data: Binance Futures
$TRUMP #TRUMP #RSI #CryptoAnalysis
⚠️ Research by Pravin Soni - DYOR