Why Does Volume Stay Strong When $WBETH Drops?
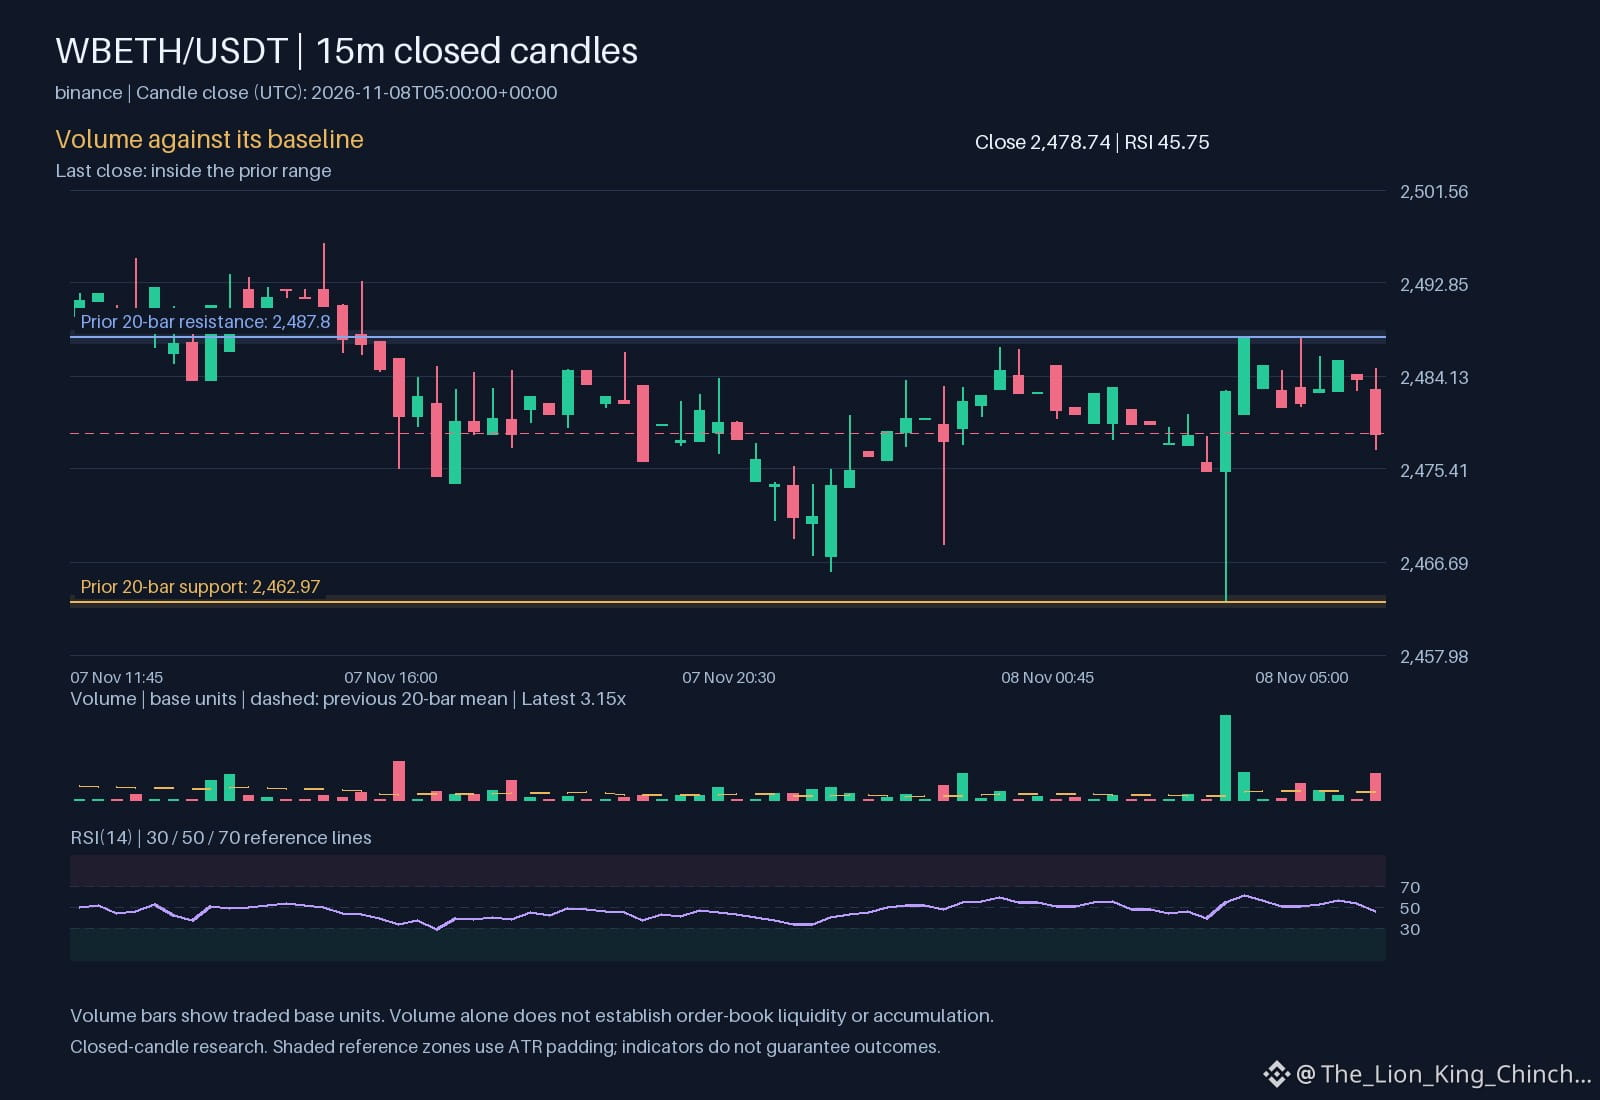
The hourly chart shows $WBETH moving down while volume remains above baseline. The clue is the mismatch between price pressure and trading activity: a falling price paired with high volume often hints at aggressive selling, yet it can also signal a temporary pullback before a bounce.
One interpretation views the strong volume as confirmation that sellers are in control, pushing the price toward the identified support level. If the next hourly candle continues lower and the price approaches 2462.97, the bearish view gains weight.
An alternative reading treats the volume spike as a liquidation of short positions or a defensive buying surge that could cushion the decline. In this scenario, the price may find a floor near the moving average 2481.62 and reverse.
What would weaken each scenario? A sudden drop in relative volume, expressed by a fall in 3.15468, would undermine the defensive buying argument and support the sell‑off narrative. Conversely, if the price stabilises above 2462.97 while volume stays elevated, the bearish case loses momentum and the bounce hypothesis strengthens.
To reassess, monitor the next hourly candle for a change in volume trend and the price's relation to the short‑term average. A clear shift in either metric should prompt a revision of the current interpretation.
Probabilistic market research, not a recommendation or guaranteed return.
Which observation would make you change your reading?
#WBETH #MarketAnalysis
The hourly chart shows $WBETH moving down while volume remains above baseline. The clue is the mismatch between price pressure and trading activity: a falling price paired with high volume often hints at aggressive selling, yet it can also signal a temporary pullback before a bounce.
One interpretation views the strong volume as confirmation that sellers are in control, pushing the price toward the identified support level. If the next hourly candle continues lower and the price approaches 2462.97, the bearish view gains weight.
An alternative reading treats the volume spike as a liquidation of short positions or a defensive buying surge that could cushion the decline. In this scenario, the price may find a floor near the moving average 2481.62 and reverse.
What would weaken each scenario? A sudden drop in relative volume, expressed by a fall in 3.15468, would undermine the defensive buying argument and support the sell‑off narrative. Conversely, if the price stabilises above 2462.97 while volume stays elevated, the bearish case loses momentum and the bounce hypothesis strengthens.
To reassess, monitor the next hourly candle for a change in volume trend and the price's relation to the short‑term average. A clear shift in either metric should prompt a revision of the current interpretation.
Probabilistic market research, not a recommendation or guaranteed return.
Which observation would make you change your reading?
#WBETH #MarketAnalysis