Price tells you where $ETH went. Open interest tells you who stayed in the trade.
Open interest (OI) is the number of futures contracts still open. It rises when new positions open and falls when positions close. Read it next to price:
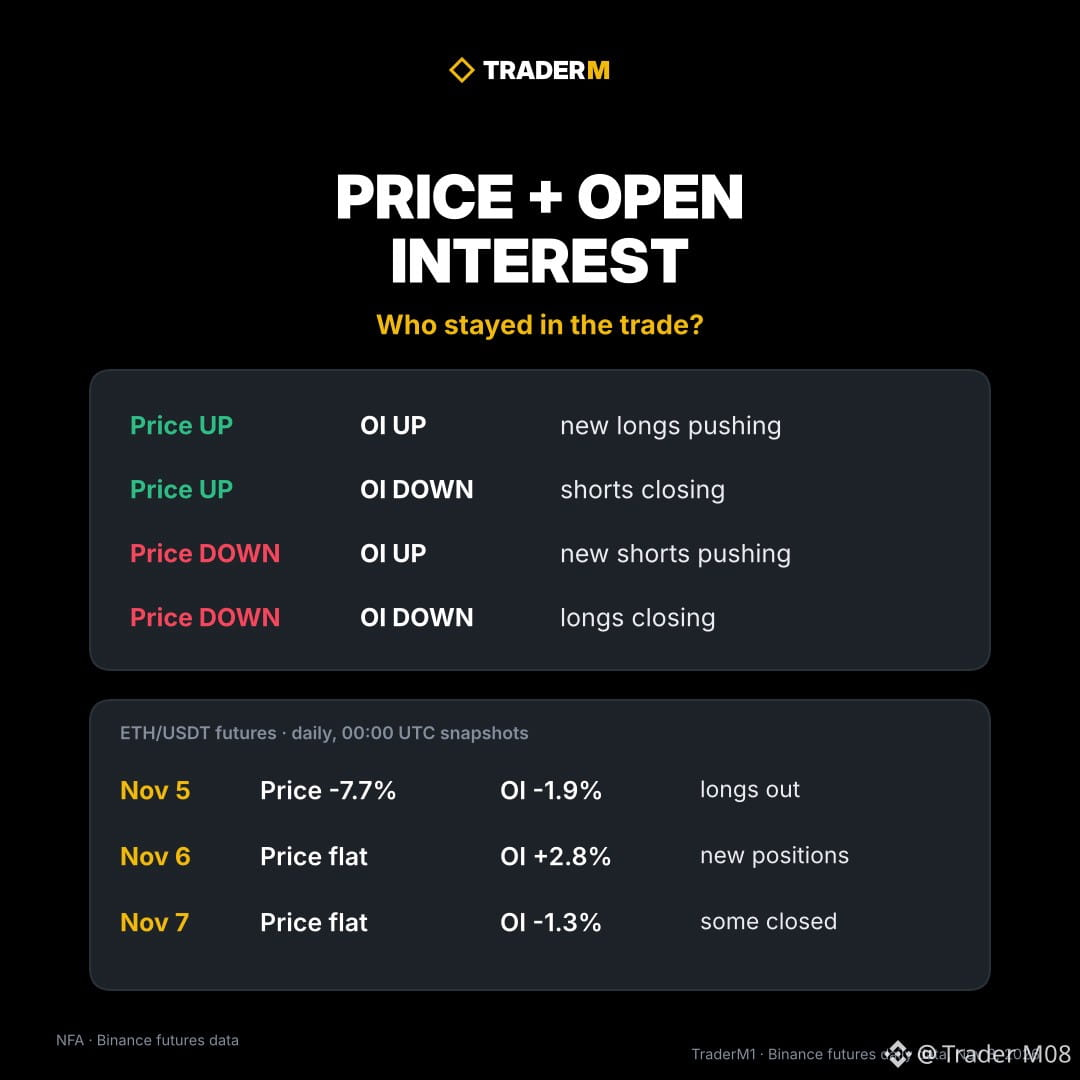
- Price up, OI up: new longs are pushing
- Price up, OI down: shorts are closing
- Price down, OI up: new shorts are pushing
- Price down, OI down: longs are closing
ETH on Binance futures last week (daily, 00:00 UTC snapshots):
- Nov 5: price fell 7.7%, from 2,424.61 to 2,238.01. OI fell 1.9% to 2.32M ETH. Mostly longs getting out
- Nov 6: price flat, 2,238.01 to 2,238.67. OI rose 2.8% to 2.39M ETH. New positions opened inside a tight range
- Nov 7: price flat again, OI down 1.3%. Some of those positions closed
OI alone doesn't give you direction. It shows how many positions sit around the range. When a flat range fills up with new positions, the break that follows tends to force one side out.
NFA. When you check a chart, do you look at open interest or only price?
$ETH
Open interest (OI) is the number of futures contracts still open. It rises when new positions open and falls when positions close. Read it next to price:
- Price up, OI up: new longs are pushing
- Price up, OI down: shorts are closing
- Price down, OI up: new shorts are pushing
- Price down, OI down: longs are closing
ETH on Binance futures last week (daily, 00:00 UTC snapshots):
- Nov 5: price fell 7.7%, from 2,424.61 to 2,238.01. OI fell 1.9% to 2.32M ETH. Mostly longs getting out
- Nov 6: price flat, 2,238.01 to 2,238.67. OI rose 2.8% to 2.39M ETH. New positions opened inside a tight range
- Nov 7: price flat again, OI down 1.3%. Some of those positions closed
OI alone doesn't give you direction. It shows how many positions sit around the range. When a flat range fills up with new positions, the break that follows tends to force one side out.
NFA. When you check a chart, do you look at open interest or only price?
$ETH