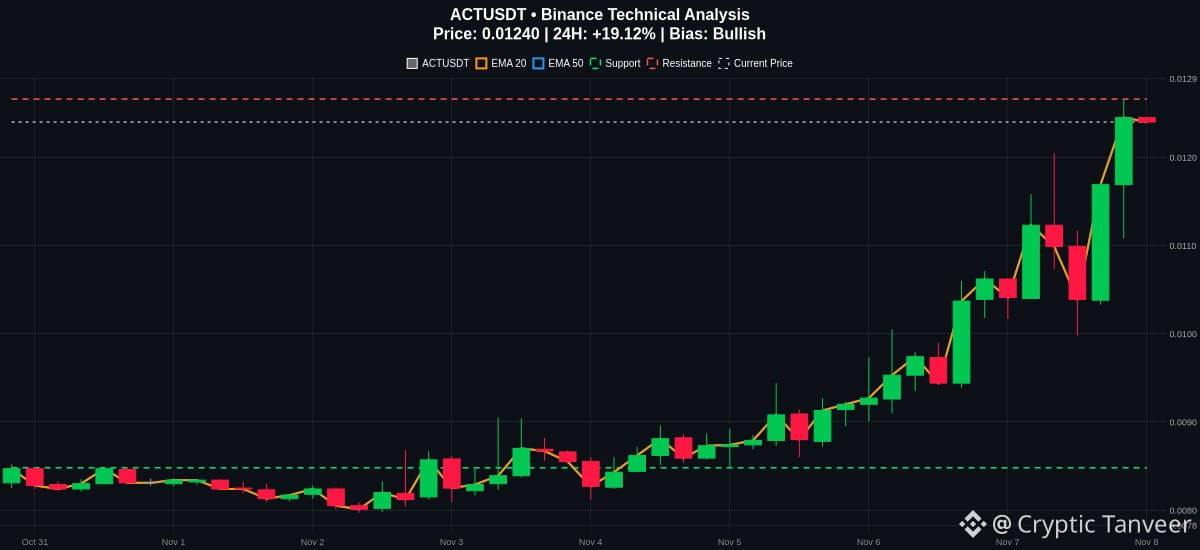
When a chart prints a 19 percent daily surge alongside a clean trend alignment, it demands a close look.
$ACT is currently trading at 0.0124, displaying strong momentum backed by a solidly bullish EMA structure. The EMA20 sits at 0.0103 while the EMA50 rests lower at 0.0094, showing clear separation that favors the current upside drive.
On the momentum side, the MACD shows positive expansion with the MACD line above the signal line. However, the RSI is currently registering at 74.47. While this indicates elevated conditions, it is not an automatic sell signal, though traders should remain aware of potential overextension risks if price stretches too far from the EMA20.
Immediate resistance is marked at 0.01266, while support rests down at 0.00848. If a pullback occurs, holding above the EMA layers will be key to sustaining the structure.
Invalidation of this bullish setup would come if price drops and breaks below the 0.00848 support level. Manage your risk carefully.
Are you looking for a retest of the moving averages or expecting a direct test of resistance?
#ACT #CryptoAnalysis #TechnicalAnalysis
Follow me for more update 📈
$ACT is currently trading at 0.0124, displaying strong momentum backed by a solidly bullish EMA structure. The EMA20 sits at 0.0103 while the EMA50 rests lower at 0.0094, showing clear separation that favors the current upside drive.
On the momentum side, the MACD shows positive expansion with the MACD line above the signal line. However, the RSI is currently registering at 74.47. While this indicates elevated conditions, it is not an automatic sell signal, though traders should remain aware of potential overextension risks if price stretches too far from the EMA20.
Immediate resistance is marked at 0.01266, while support rests down at 0.00848. If a pullback occurs, holding above the EMA layers will be key to sustaining the structure.
Invalidation of this bullish setup would come if price drops and breaks below the 0.00848 support level. Manage your risk carefully.
Are you looking for a retest of the moving averages or expecting a direct test of resistance?
#ACT #CryptoAnalysis #TechnicalAnalysis
Follow me for more update 📈