

During the immediate minutes surrounding a U.S. Consumer Price Index (CPI) release (specifically 8:30 AM Eastern Time), Gold (XAU/USD) and the U.S. Dollar Index (DXY) almost universally move in opposite directions.
The primary catalyst for this inverse relationship is not just the inflation number itself, but how that number shifts expectations for Federal Reserve interest rate policy, real Treasury yields, and short-term liquidity.
1. The Direct Macro Mechanism: Why They Move Inversely
Pricing Currency Mechanics: Gold is globally priced in U.S. Dollars. When the Dollar strengthens, purchasing an ounce of gold becomes more expensive for non-USD foreign buyers, reducing demand and dragging gold's dollar value down.
Opportunity Cost & Real Yields: Gold produces no yield (0% interest). Higher inflation data raises expectations that the Federal Reserve will hike interest rates or keep them "higher for longer". Higher rates push up Treasury bond yields and cash returns, raising the opportunity cost of holding non-yielding Gold while boosting demand for the U.S. Dollar.
2. Market Reactions by CPI Outcome
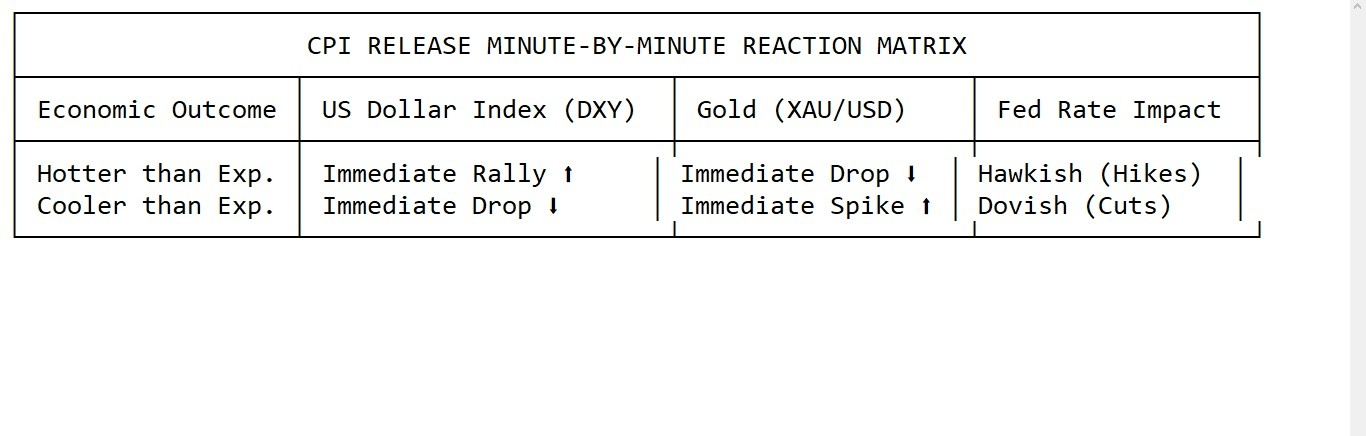
Scenario A: Hotter-Than-Expected CPI (Inflation Surges)
DXY (Dollar): Spikes sharply upward within seconds. Traders buy the USD expecting the Federal Reserve to tighten monetary policy aggressively or delay rate cuts.
Gold (XAU/USD): Drops rapidly. Although Gold is traditionally an "inflation hedge," short-term traders prioritize rising Treasury yields and a stronger Dollar over long-term inflation defense, causing Gold to break below local support.
Scenario B: Cooler-Than-Expected CPI (Inflation Eases)
DXY (Dollar): Sinks immediately. Rate hike fears dissolve, and traders price in upcoming Fed interest rate cuts.
Gold (XAU/USD): Surges sharply higher. Falling bond yields lower the opportunity cost of holding precious metals, driving aggressive buying into Gold.
3. Minute-by-Minute Execution Breakdown (The 30-Minute Cycle)
Trading volume during CPI minutes is among the highest of any monthly economic release. Market microstructure typically unfolds across three distinct phases:
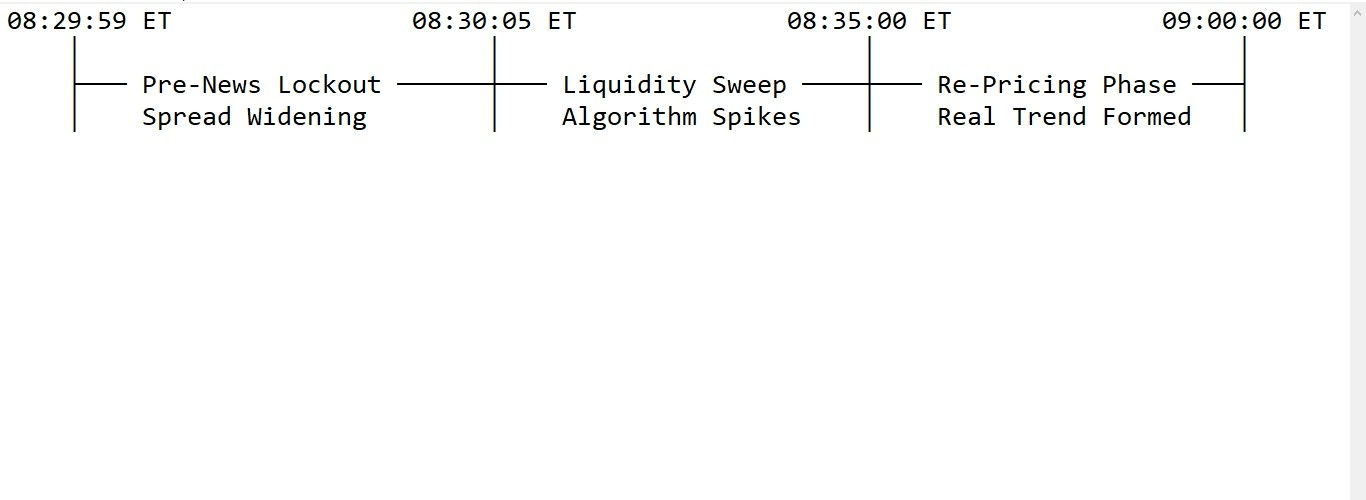
Minutes 0–1 (08:30:00 to 08:31:00 ET) — The Initial Liquidity Sweep:
High-frequency algorithmic trading programs process the headline data in milliseconds.
Spreads on XAU/USD expand significantly (sometimes 5x–10x normal levels).
Fakeouts are extremely common: The first 15–30 seconds often feature erratic wicks in both directions as algorithms clear existing buy/sell stop orders before settling into a direction.
Minutes 2–15 (08:32:00 to 08:45:00 ET) — Directional Momentum:
Spread spreads begin to normalize.
The actual relationship takes over: If DXY establishes a clear 5-minute green candle, Gold will form a corresponding red 5-minute candle with strong body continuation.
Minutes 15–30 (08:45:00 to 09:00:00 ET) — Core Component Re-assessment:
Human institutional traders digest sub-metrics (such as Core CPI vs. Headline CPI or Supercore Services Inflation).
If Headline CPI was hot but Core CPI came in soft, the initial Gold sell-off may completely reverse, causing a V-shaped recovery while DXY gives back its initial gains.
4. Key Exceptions: When the Inverse Correlation Breaks
Occasionally, DXY and Gold move in the same direction during a CPI release. This occurs under two macro conditions:
Extreme Stagflation / Systemic Fear: If CPI comes in exceptionally hot alongside weak economic growth metrics, markets fear severe economic stagflation. Investors dump stocks and buy both cash (USD) and hard safe-haven assets (Gold) simultaneously.
De-Dollarization / Geopolitical Stress: If international central banks are actively diversifying reserves out of USD assets during high inflation periods, Gold may rally despite a rising DXY.