🔴 $BNB /USDT · Bias: SHORT
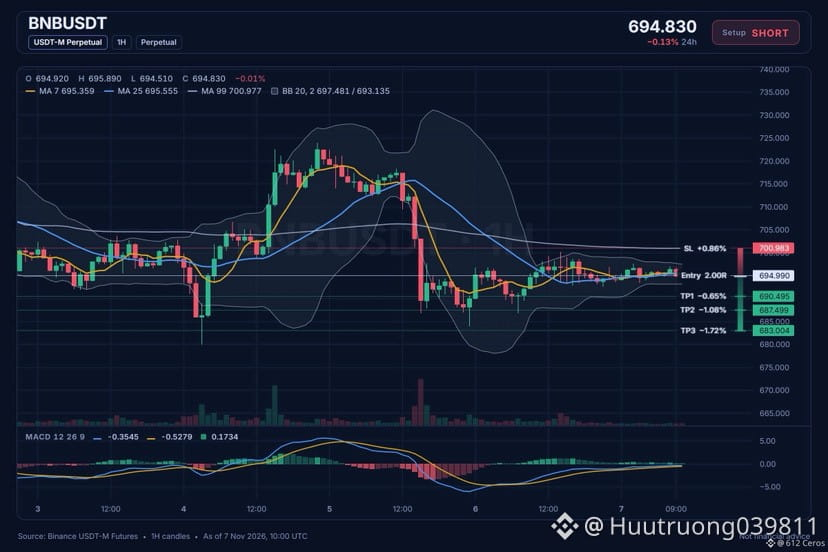
Price sits below both EMAs on the 4h chart, showing a bearish stack.
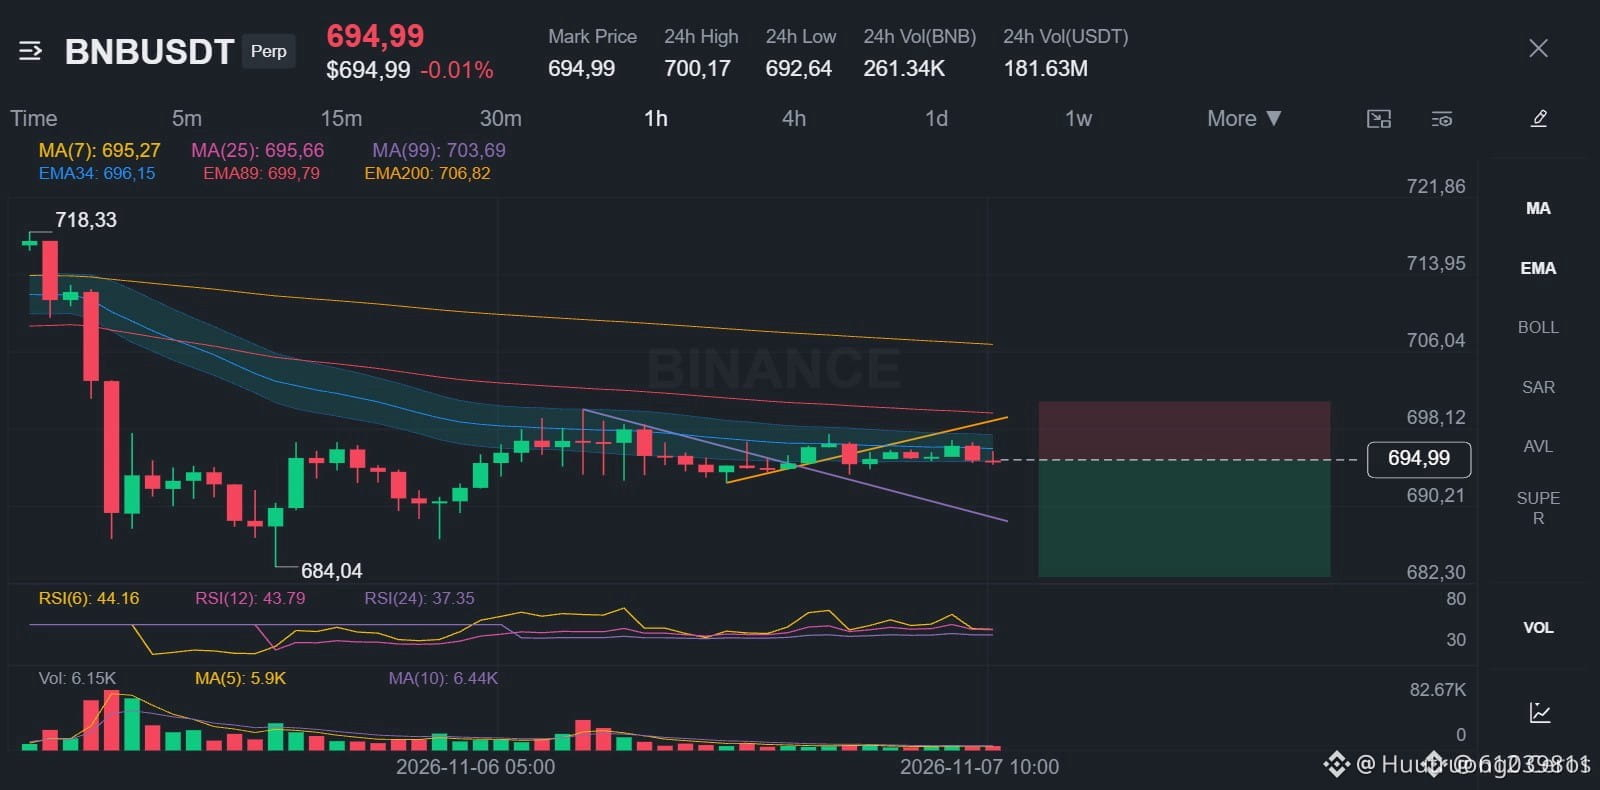
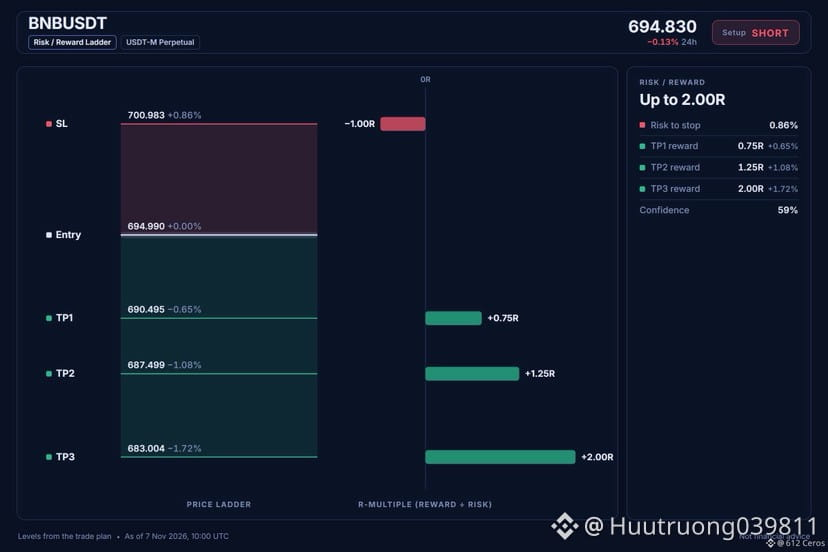
Entry: 694.817 – 695.163
TP1: 690.495 (-0.6%)
TP2: 687.499 (-1.1%)
TP3: 683.004 (-1.7%)
SL: 700.983 (+0.9%)
Note: moderate conviction only, keep size light.
Why: The 4h trend shows price below EMA50 and EMA200, a bearish stack meaning the swing trend is down.
Plan: close 50% at TP1, 25% at TP2, 25% at TP3, and move the stop to entry after TP1.
Do you see room for more downside from here?
Price sits below both EMAs on the 4h chart, showing a bearish stack.
Entry: 694.817 – 695.163
TP1: 690.495 (-0.6%)
TP2: 687.499 (-1.1%)
TP3: 683.004 (-1.7%)
SL: 700.983 (+0.9%)
Note: moderate conviction only, keep size light.
Why: The 4h trend shows price below EMA50 and EMA200, a bearish stack meaning the swing trend is down.
Plan: close 50% at TP1, 25% at TP2, 25% at TP3, and move the stop to entry after TP1.
Do you see room for more downside from here?