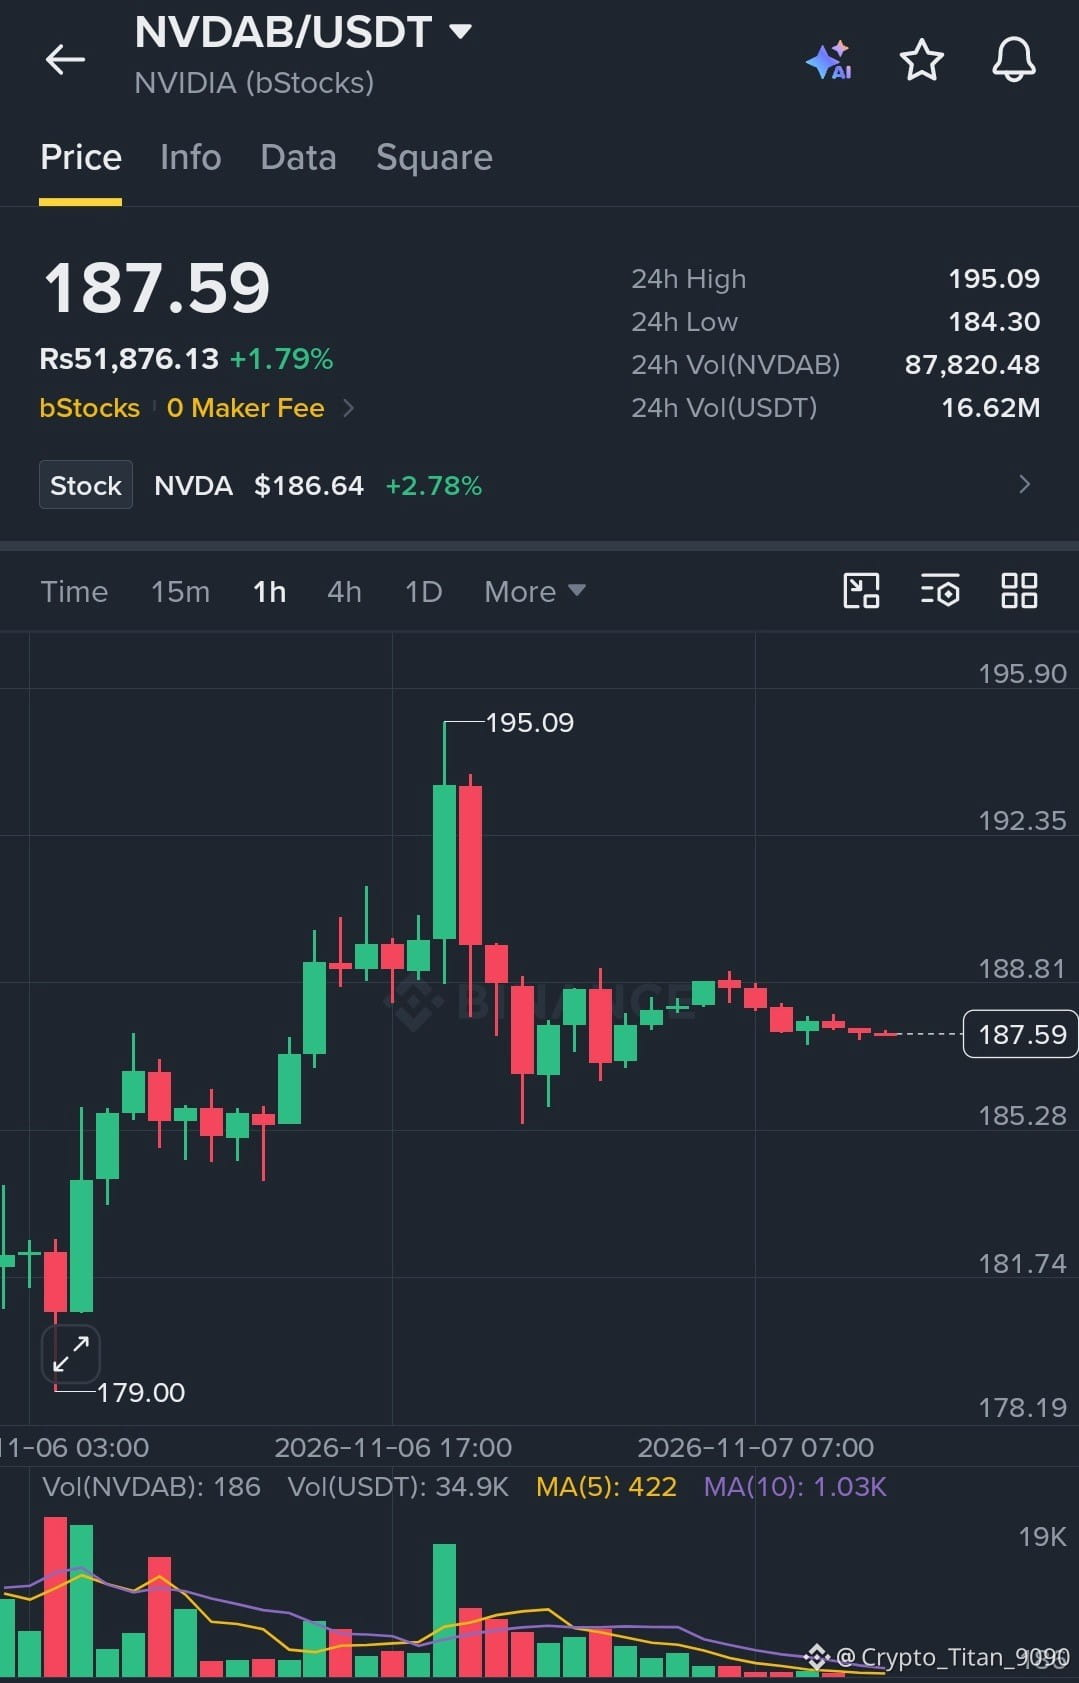
$NVDAB · 4H
Over the past two weeks, $NVDAB has traded between $179.00 and $220.45. It’s now at $187.59, below both its 20- and 50-period four-hour averages and in the lower third of the range. Nearby support is about 4.6% below, while the range high remains much farther away. The 20-period average has stayed under the 50-period average for 56 candles. RSI is 36, indicating mid-range momentum.
In the last 24 hours, the price has ranged from $184.05 to $195.09 and is now near the midpoint. Volume is about 2.2× its recent average, suggesting stronger trading activity. is up 1.9% over 24 hours.
Binance spot data. DYOR
$NVDAB #Binance
Over the past two weeks, $NVDAB has traded between $179.00 and $220.45. It’s now at $187.59, below both its 20- and 50-period four-hour averages and in the lower third of the range. Nearby support is about 4.6% below, while the range high remains much farther away. The 20-period average has stayed under the 50-period average for 56 candles. RSI is 36, indicating mid-range momentum.
In the last 24 hours, the price has ranged from $184.05 to $195.09 and is now near the midpoint. Volume is about 2.2× its recent average, suggesting stronger trading activity. is up 1.9% over 24 hours.
Binance spot data. DYOR
$NVDAB #Binance