$BNB: Hourly Rise, Uneven Participation
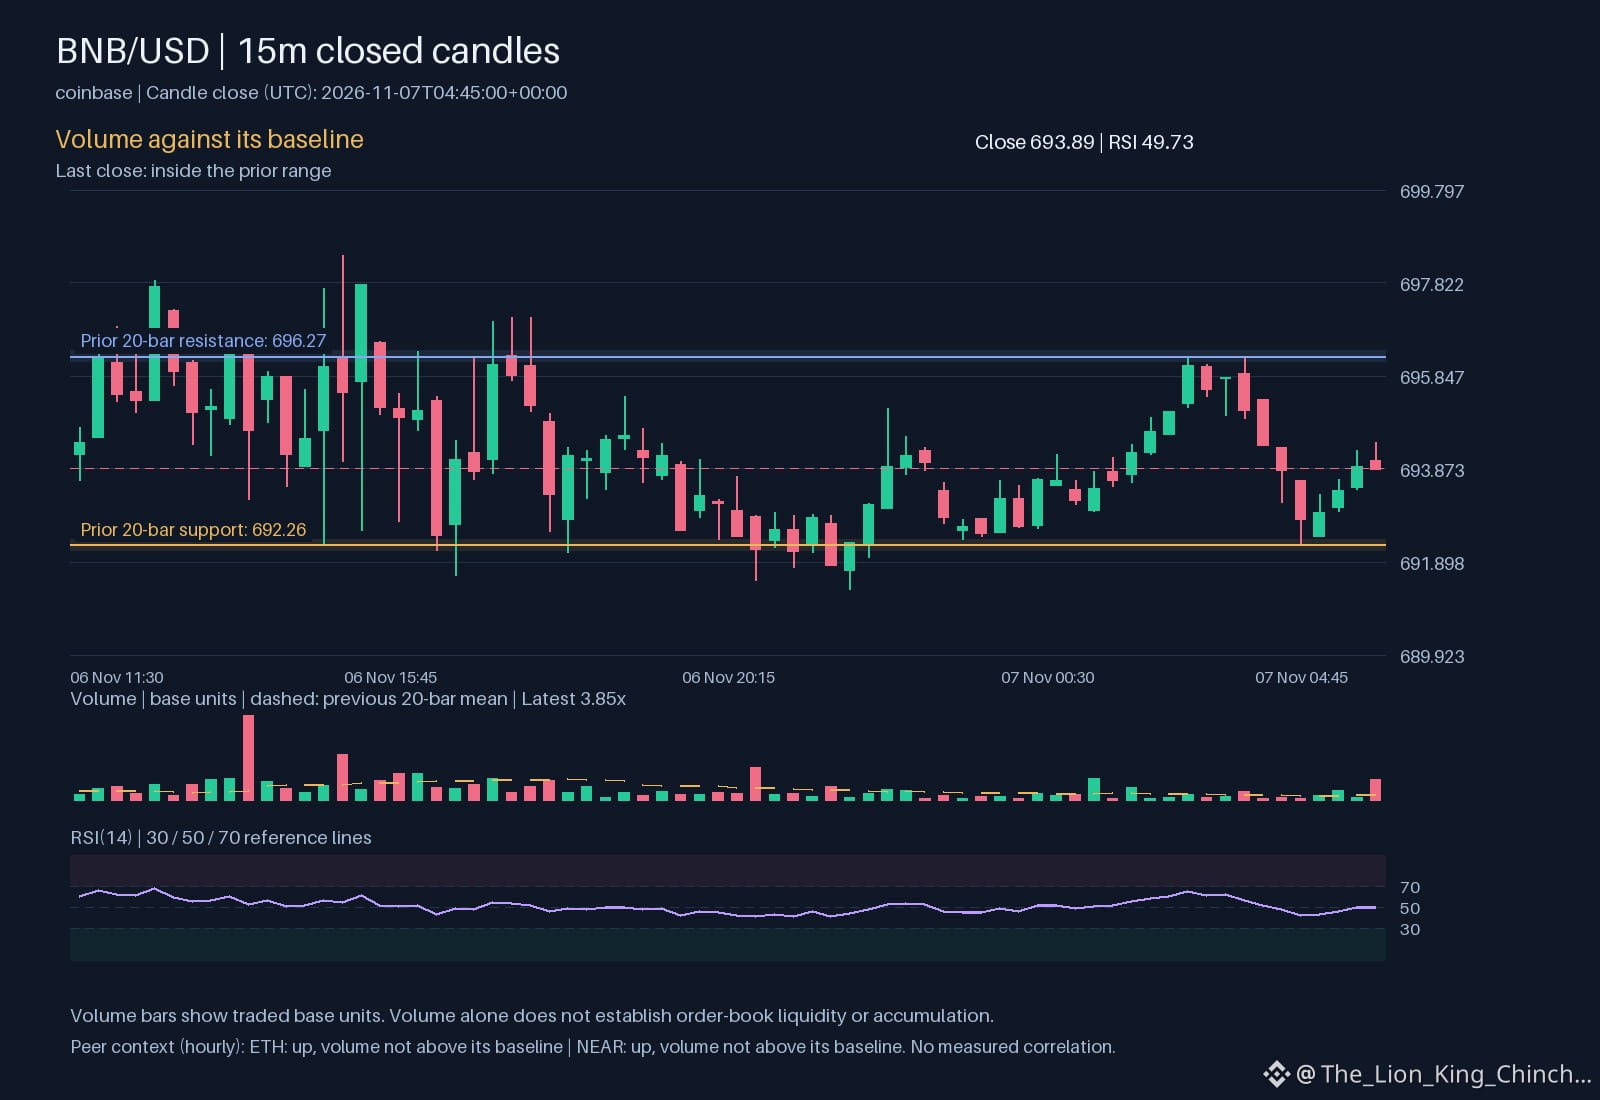
BNB is trading up on the hourly chart with volume above baseline. This suggests active participation compared to the recent quiet norm. The price sits at 693.89. Technical indicators show RSI at 49.7271 and MACD at 0.0196753. The signal line is 0.148645. These values describe current momentum. They do not predict future path. At the same hourly venue, ETH and NEAR are also moving up. However, their volume is not above baseline. This difference matters. BNB has a volume boost. Its peers do not. A shared upward direction does not prove capital rotation. It does not imply a common cause. It is not a measured correlation. It simply lists three coins moving up at the same time. Some may be driven by specific orders. Others may drift with broader sentiment. The limit here is that we lack data on trader intent. We cannot verify if funds moved from one asset to another. We only observe price and volume states. To reassess, watch if BNB holds above 692.26. If volume fades on the next hourly candle, the initial impulse may lack follow-through. A quiet continuation could indicate weak conviction. Conversely, sustained volume supports the move's robustness. This is a conditional mechanism. It is not a guarantee. The article focuses on this specific divergence. It avoids claiming BNB is a top gainer in the whole market. It treats the peer data as a contrast, not a validation. The core question is whether the direction leads to lasting structure or fades quickly. That depends on how the move holds, not just its initial rise.
Probabilistic market research, not a recommendation or guaranteed return.
The comparison to keep in mind: $ETH has hourly direction up and volume not above its baseline; $NEAR has hourly direction up and volume not above its baseline. This alone does not establish correlation.
Which matters more in this comparison: direction or how the move holds?
#BNB #ETH
BNB is trading up on the hourly chart with volume above baseline. This suggests active participation compared to the recent quiet norm. The price sits at 693.89. Technical indicators show RSI at 49.7271 and MACD at 0.0196753. The signal line is 0.148645. These values describe current momentum. They do not predict future path. At the same hourly venue, ETH and NEAR are also moving up. However, their volume is not above baseline. This difference matters. BNB has a volume boost. Its peers do not. A shared upward direction does not prove capital rotation. It does not imply a common cause. It is not a measured correlation. It simply lists three coins moving up at the same time. Some may be driven by specific orders. Others may drift with broader sentiment. The limit here is that we lack data on trader intent. We cannot verify if funds moved from one asset to another. We only observe price and volume states. To reassess, watch if BNB holds above 692.26. If volume fades on the next hourly candle, the initial impulse may lack follow-through. A quiet continuation could indicate weak conviction. Conversely, sustained volume supports the move's robustness. This is a conditional mechanism. It is not a guarantee. The article focuses on this specific divergence. It avoids claiming BNB is a top gainer in the whole market. It treats the peer data as a contrast, not a validation. The core question is whether the direction leads to lasting structure or fades quickly. That depends on how the move holds, not just its initial rise.
Probabilistic market research, not a recommendation or guaranteed return.
The comparison to keep in mind: $ETH has hourly direction up and volume not above its baseline; $NEAR has hourly direction up and volume not above its baseline. This alone does not establish correlation.
Which matters more in this comparison: direction or how the move holds?
#BNB #ETH