🚀 $LYN USDT — Bulls Are Taking Control, But One Key Retest Matters!
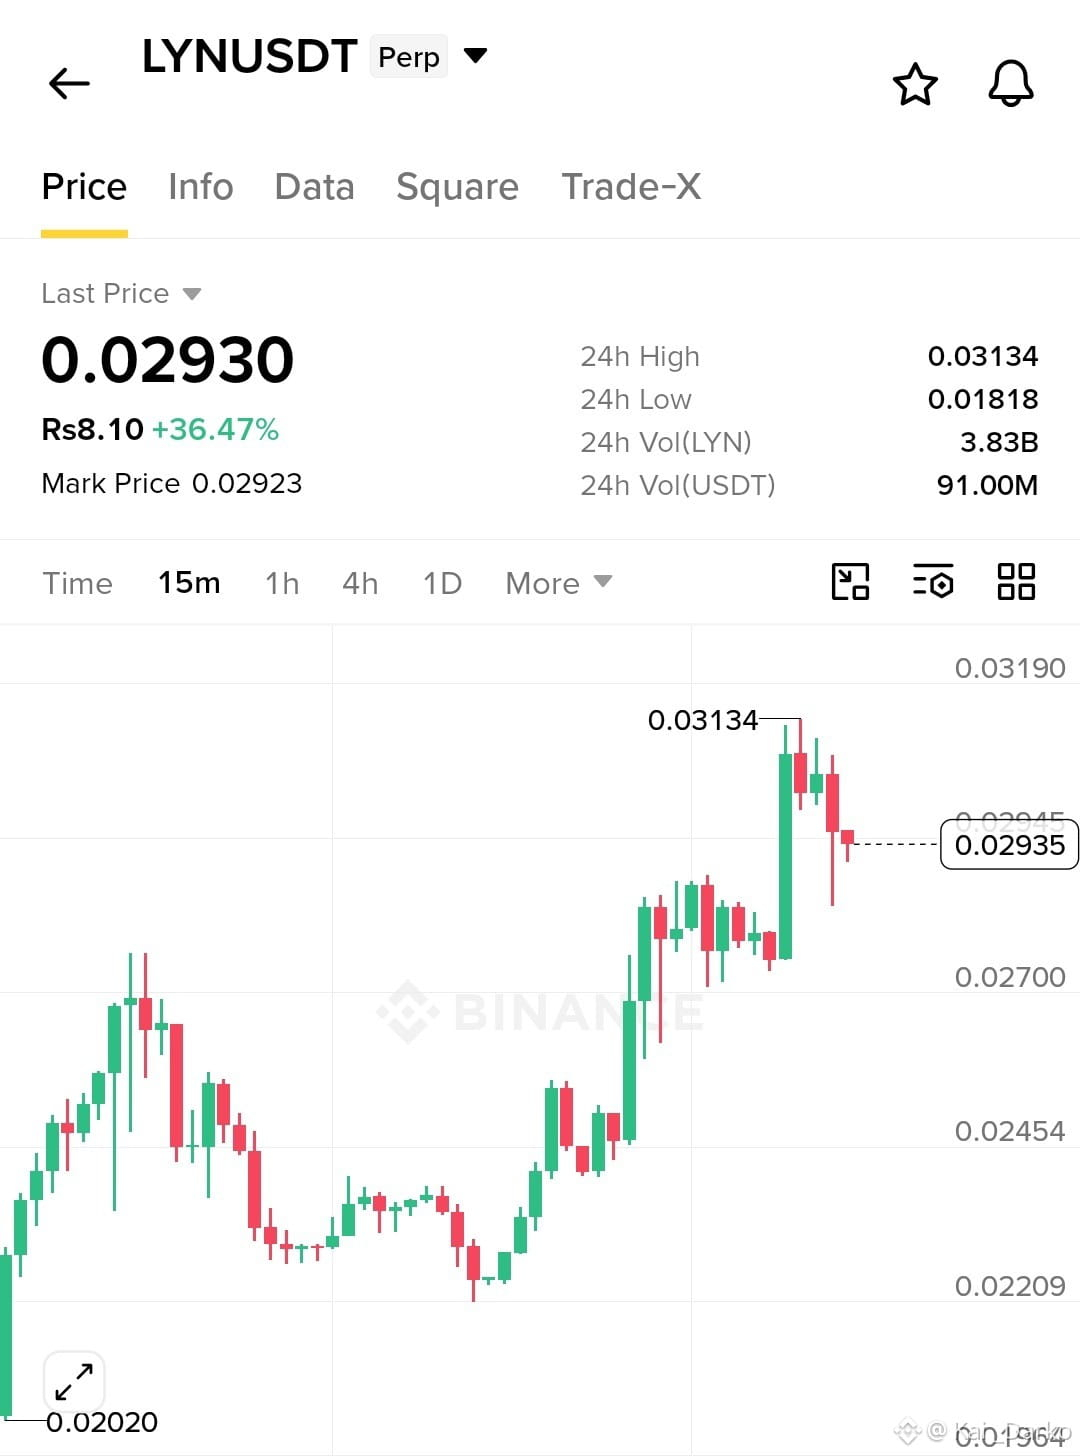
$LYN USDT is showing impressive strength on the 15-minute chart, trading around $0.02930, up 36.47%. After recovering from the $0.02020 low, buyers pushed price through the $0.02700 resistance and drove it to a new 24H high of $0.03134. Now we are seeing a healthy pullback after that aggressive rally.
The overall short-term structure remains bullish, with higher highs and a strong recovery. However, I would not chase the current move. The $0.0280–$0.0287 area is worth watching for a potential retest and renewed buying interest.
🎯 My Trading Plan:
Entry Zone: $0.0280–$0.0287
Stop Loss: $0.0264
TP1: $0.0303
TP2: $0.03134
TP3: $0.0320 (only after a confirmed breakout above the previous high).
The $0.0270 region is an important support area, while the estimated 38.2% retracement of the visible rally sits close to $0.0271. A hold above this region would help preserve bullish momentum. A breakdown below $0.0264 would invalidate this trade idea.
Important: EMA, RSI and MACD readings cannot be confirmed from this screenshot because those indicators are not displayed.
📈 My View: Buyers still have the advantage, but resistance near $0.03134 is the real test. I prefer waiting for a confirmed retest instead of entering emotionally after a 36% rally. Manage position size and protect capital.
Are you buying the pullback or waiting for a breakout? 👀
$LYN USDT is showing impressive strength on the 15-minute chart, trading around $0.02930, up 36.47%. After recovering from the $0.02020 low, buyers pushed price through the $0.02700 resistance and drove it to a new 24H high of $0.03134. Now we are seeing a healthy pullback after that aggressive rally.
The overall short-term structure remains bullish, with higher highs and a strong recovery. However, I would not chase the current move. The $0.0280–$0.0287 area is worth watching for a potential retest and renewed buying interest.
🎯 My Trading Plan:
Entry Zone: $0.0280–$0.0287
Stop Loss: $0.0264
TP1: $0.0303
TP2: $0.03134
TP3: $0.0320 (only after a confirmed breakout above the previous high).
The $0.0270 region is an important support area, while the estimated 38.2% retracement of the visible rally sits close to $0.0271. A hold above this region would help preserve bullish momentum. A breakdown below $0.0264 would invalidate this trade idea.
Important: EMA, RSI and MACD readings cannot be confirmed from this screenshot because those indicators are not displayed.
📈 My View: Buyers still have the advantage, but resistance near $0.03134 is the real test. I prefer waiting for a confirmed retest instead of entering emotionally after a 36% rally. Manage position size and protect capital.
Are you buying the pullback or waiting for a breakout? 👀