

Introduction: Is the Next Altcoin Season Approaching?
The cryptocurrency market moves through different cycles. Sometimes Bitcoin leads the market, while at other times Ethereum and other altcoins outperform Bitcoin.
One of the most discussed topics among crypto investors is the altcoin season. During this period, many altcoins experience stronger price performance than Bitcoin.
But how can we identify whether the market is moving towards an altcoin season?
Simply watching Bitcoin's price is not enough. We need to understand Bitcoin Dominance, Ethereum's relative strength, Solana's performance, trading volume, market capitalisation and overall market sentiment.
In this article, we will examine three major cryptocurrencies:
Bitcoin ( $BTC ): The leading cryptocurrency and a key indicator of overall market direction.
Ethereum ( $ETH ): A major smart-contract blockchain and an important indicator of altcoin market strength.
S$olana ( $SOL ): A high-performance blockchain with a growing ecosystem of decentralised finance, applications and digital assets.
We will use practical examples and hypothetical numbers to understand how these indicators work.
The goal is not to predict exact prices. It is to understand how to analyse market conditions before deciding whether an altcoin rally is developing.
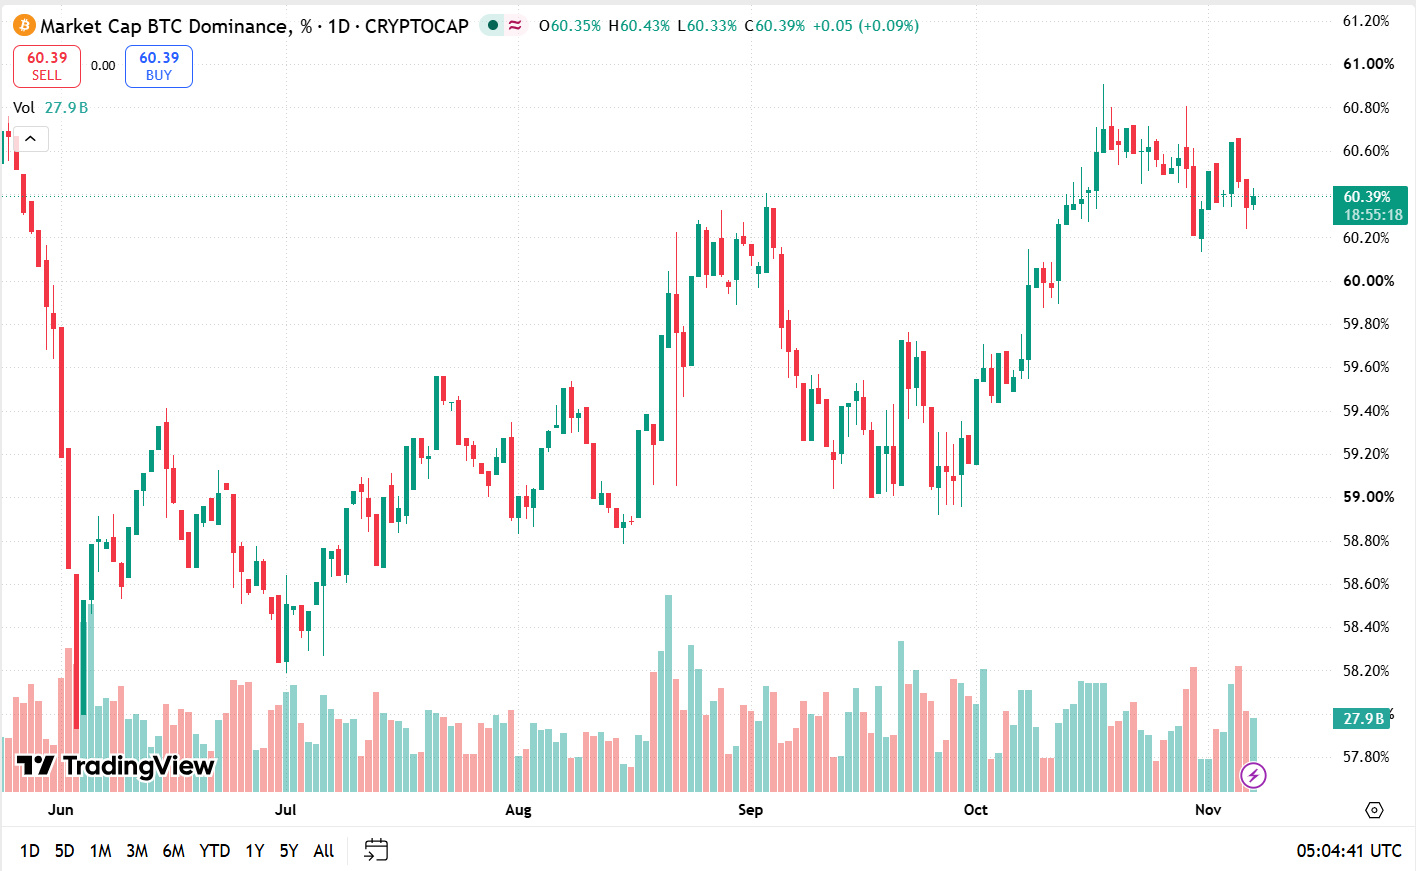
1. Understanding Bitcoin Dominance (BTC.D)
Bitcoin Dominance measures Bitcoin's share of the total cryptocurrency market capitalisation.
It helps analysts understand whether Bitcoin is outperforming the broader cryptocurrency market.
The formula is:
BTC.D = [frac{BTC Market Cap}{Total Crypto Market Cap}] *100
Let's understand this with an example.
Imagine the cryptocurrency market has the following market capitalisation:
Cryptocurrency category Market capitalisation
Bitcoin $1.2 trillion
All other cryptocurrencies $800 billion
Total crypto market $2 trillion
Bitcoin Dominance would be:
[frac{1.2}{2.0}] times100 = 60%
This means Bitcoin represents 60% of the total cryptocurrency market capitalisation.
The remaining 40% belongs to other cryptocurrencies.
Why is BTC Dominance important?
When BTC Dominance rises, Bitcoin is generally gaining market share relative to other cryptocurrencies.
When BTC Dominance falls, other cryptocurrencies are gaining market share relative to Bitcoin.
However, there is an important detail: BTC Dominance does not tell us whether Bitcoin's price is rising or falling. We must analyse both together.
2. Two Practical Examples of Bitcoin Dominance
Let's examine two hypothetical market situations.
Example A: Bitcoin rises faster than altcoins
Suppose Bitcoin's market capitalisation increases by 10%, while the altcoin market remains unchanged.
Metric Before After
BTC market cap $1.2T $1.32T
Altcoin market cap $800B $800B
Total market cap $2T $2.12T
BTC Dominance 60% 62.26%
Bitcoin Dominance increases from 60% to approximately 62.26%.
Interpretation:
Bitcoin is outperforming the broader market.
This could indicate that investors are showing stronger interest in Bitcoin compared with altcoins.
It does not necessarily mean that altcoin prices are falling. They may simply be performing more slowly than Bitcoin.
Example B: Bitcoin falls, but altcoins fall faster
Now imagine Bitcoin loses 10% of its market capitalisation while the altcoin market loses 20%.
Metric Before After
BTC market cap $1.2T $1.08T
Altcoin market cap $800B $640B
Total market cap $2T $1.72T
BTC Dominance 60% 62.79%
Bitcoin Dominance increases to approximately 62.79%.
But notice something important: Bitcoin is also falling.
Interpretation:
Altcoins are experiencing greater losses than Bitcoin.
This demonstrates why rising BTC Dominance is not automatically a bullish signal.
Key lesson: Always compare BTC Dominance with Bitcoin's actual price trend.

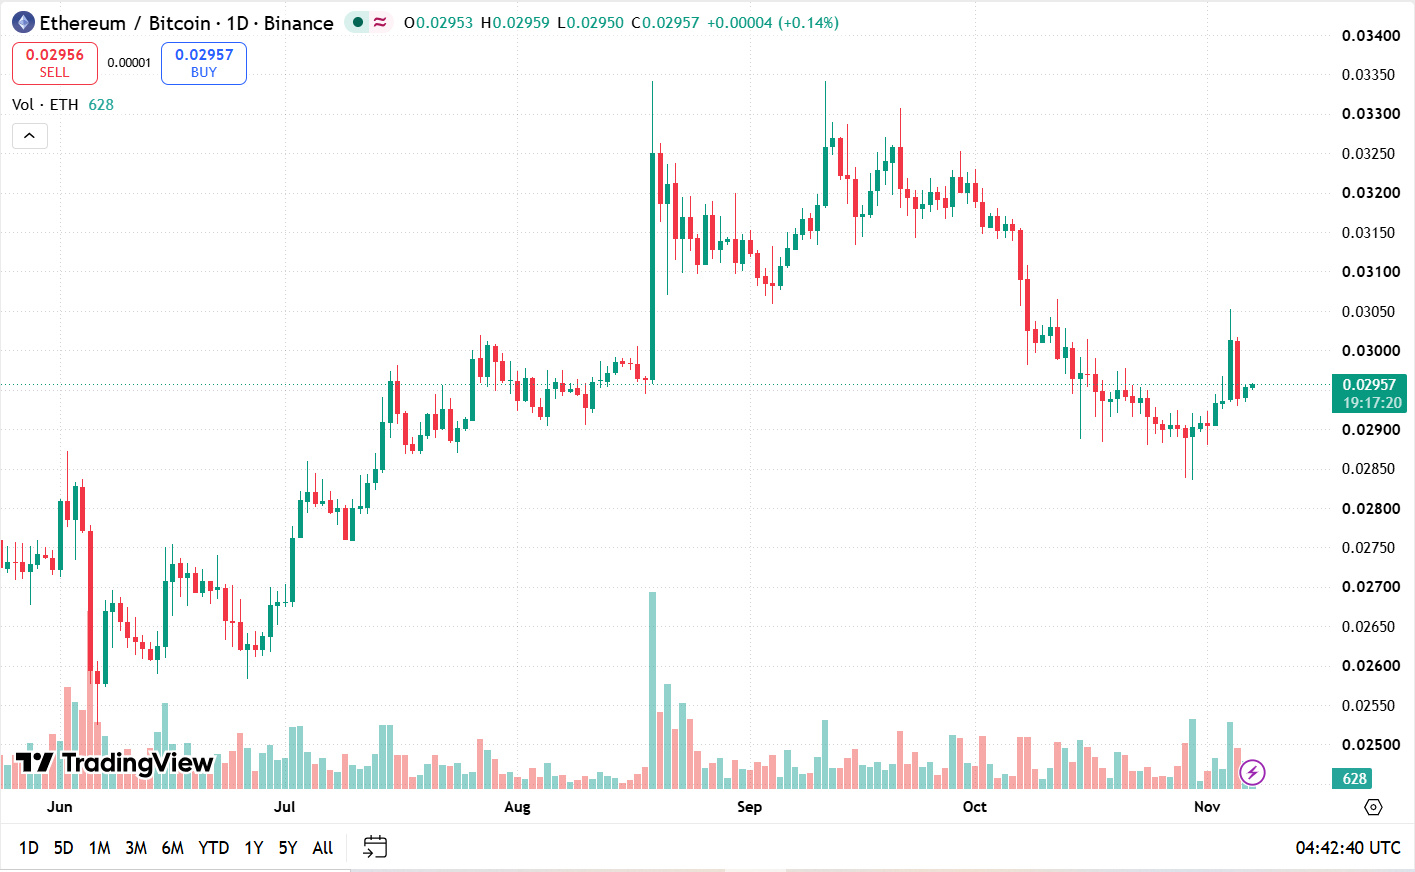
3. Ethereum: Understanding the ETH/BTC Ratio
Ethereum is one of the most important cryptocurrencies to monitor when analysing the broader altcoin market.
However, looking only at ETH's dollar price does not give us the complete picture.
We should also analyse the ETH/BTC ratio.
The formula is:
ETH/BTC = [ frac{ETHPrice}{BTC Price} ]
This ratio measures the value of Ethereum relative to Bitcoin.
Let's consider a hypothetical example.
Starting prices:
ETH = $3,000
BTC = $100,000
ETH/BTC = 0.030
Scenario A: Ethereum underperforms Bitcoin
Imagine:
ETH increases by 5% to $3,150.
BTC increases by 10% to $110,000.
The new ratio becomes:
[ frac{3150}{110000} = 0.02864 ]
Ethereum's dollar price has increased, but its ratio against Bitcoin has decreased.
This means Ethereum has underperformed Bitcoin.
Scenario B: Ethereum outperforms Bitcoin
Now imagine:
ETH increases by 15% to $3,450.
BTC increases by 5% to $105,000.
The new ratio becomes:
[ frac{3450}{105000} = 0.03286 ]
The ETH/BTC ratio has increased.
This indicates that Ethereum has outperformed Bitcoin.
Why does this matter?
If ETH/BTC shows a sustained upward trend, it can indicate improving relative strength in Ethereum.
However, one or two positive candles are not enough. Analysts should examine the broader trend, volume and market conditions.
4. Solana: Why SOL Deserves Special Attention
Solana is another important cryptocurrency to monitor when analysing altcoin market conditions.
Solana is a Layer-1 blockchain designed to support fast transactions and relatively low transaction costs.
Its ecosystem includes:
Decentralised finance (DeFi).
Decentralised exchanges (DEXs).
Stablecoin transactions.
Staking applications.
Tokenised real-world assets.
Consumer and payment applications.
Solana's importance is not limited to its token price.
Its ecosystem activity can provide additional information about demand for blockchain applications.
What should analysts monitor in Solana?
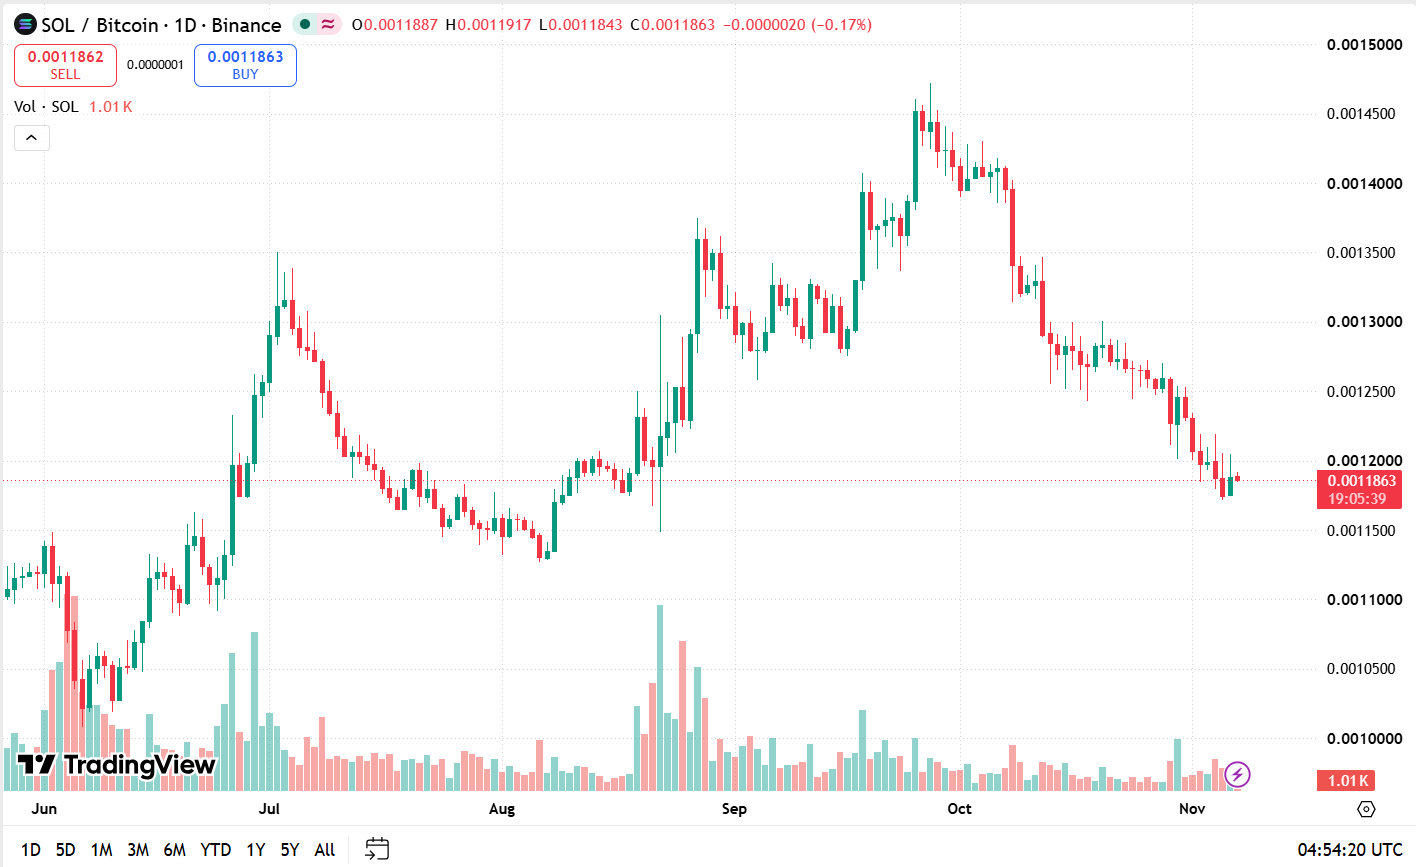
This measures Solana's performance relative to Bitcoin.
A sustained increase can indicate that SOL is outperforming BTC.
This compares Solana's performance against Ethereum.
It helps analysts understand whether SOL is gaining or losing relative strength against another major smart-contract platform.
3. Solana DEX volume
Increasing decentralised exchange volume can indicate greater trading activity across the Solana ecosystem.
However, high volume does not always mean healthy long-term growth. Analysts should also consider liquidity, market conditions and the nature of trading activity.
4. Total Value Locked (TVL)
TVL measures the value of assets deposited in DeFi protocols.
Growing TVL may indicate increased participation in decentralised finance, although changes in token prices can also affect the reported dollar value.
5. Network performance and adoption
Analysts should monitor network reliability, transaction activity, developer activity and actual application usage.
A blockchain's long-term development should not be judged by token price alone.

5. Understanding SOL/BTC With a Practical Example
Let's use hypothetical prices to understand Solana's relative performance.
Suppose:
SOL = $200
BTC = $100,000
[ frac{200}{100000} ] = 0.002
Now imagine that:
SOL increases by 15% to $230.
BTC increases by 5% to $105,000.
[ frac{230}{105000} } = 0.00219
The ratio has increased by approximately 9.5%.
Interpretation:
Solana has outperformed Bitcoin during this hypothetical period.
This could indicate improving relative strength.
However, one positive move does not confirm a long-term trend. We should check whether the ratio continues to make higher highs and higher lows and whether trading volume supports the move.
What about SOL/ETH?
Suppose Solana increases by 10%, while Ethereum increases by 20%.
Both cryptocurrencies are rising in dollar terms, but Ethereum is performing better.
This is why analysing SOL/ETH can provide additional information about competition and relative strength between major blockchain ecosystems.
6. Five Important Indicators to Monitor Before Calling an Altcoin Season
A decline in Bitcoin Dominance alone is not enough to confirm an altcoin season.
I would monitor these indicators together.
Indicator What analysts should look for
BTC Dominance A sustained decline
ETH/BTC Improving Ethereum relative strength
SOL/BTC Improving Solana relative strength
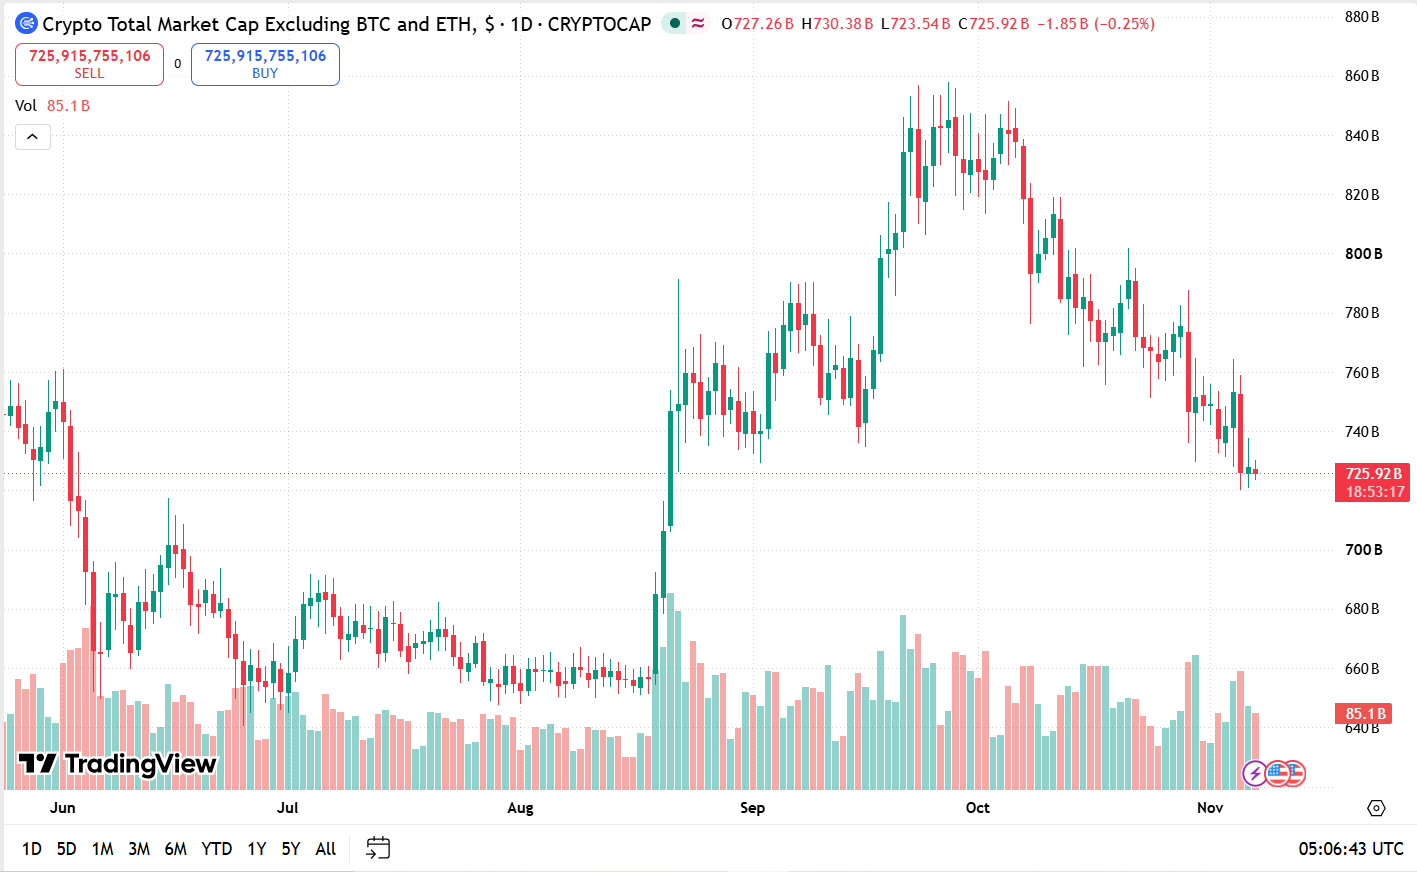
TOTAL2 and TOTAL3 Growth in the wider altcoin market
Trading volume Increasing participation across multiple altcoins
Stablecoin Dominance Whether investors are moving into stablecoins instead of altcoins
What are TOTAL2 and TOTAL3?
These are commonly used cryptocurrency market-capitalisation chart metrics.
TOTAL2: Total cryptocurrency market capitalisation excluding Bitcoin.
TOTAL3: Total cryptocurrency market capitalisation excluding Bitcoin and Ethereum.
If TOTAL2 and TOTAL3 show sustained growth, it can indicate that market strength is spreading beyond Bitcoin and Ethereum.
However, these indicators should be interpreted alongside stablecoin market capitalisation and broader market conditions.
Why is stablecoin dominance important?
Imagine investors sell their Bitcoin and altcoins and move their funds into stablecoins such as USDT or USDC.
Bitcoin Dominance may decline, but this does not necessarily mean investors are buying altcoins.
They may simply be reducing their exposure to volatile cryptocurrencies.
Therefore, falling BTC Dominance should be supported by improving altcoin prices, relative strength and trading volume before treating it as a potential altcoin-season signal.
7. Three Possible Cryptocurrency Market Scenarios$$
Let's combine the indicators discussed above.
Scenario 1: Bitcoin-led market
Possible conditions:
BTC price shows strength.
BTC Dominance rises.
ETH/BTC remains weak.
SOL/BTC remains weak.
Altcoins underperform Bitcoin.
Interpretation: Bitcoin is leading the market, and capitalisation performance is concentrated in BTC.
Scenario 2: Large-cap altcoin expansion
Possible conditions:
Bitcoin price stabilises or continues rising gradually.
BTC Dominance begins declining.
ETH/BTC starts improving.
SOL/BTC starts improving.
TOTAL2 and TOTAL3 show growth.
Trading volume increases across several altcoins.
Interpretation: Market strength may be spreading beyond Bitcoin.
This could be an early indication of broader altcoin participation, but confirmation requires sustained performance.
Scenario 3: Broad cryptocurrency market correction
Possible conditions:
Bitcoin price declines.
Ethereum and Solana decline more sharply.
BTC Dominance increases.
Altcoin trading volume weakens.
Market sentiment becomes negative.
Interpretation: Investors may be reducing exposure to riskier cryptocurrencies.
These scenarios are analytical frameworks, not guaranteed patterns or predictions.
8. Spot Market vs Futures Market: What Should Analysts Watch?
Since cryptocurrency analysis involves both Spot and Futures markets, it is useful to understand their differences.
Spot market analysis
Spot trading involves buying or selling the actual cryptocurrency.
For market research, analysts can examine:
Price trends.
Support and resistance.
Trading volume.
Moving averages.
RSI and MACD.
Market capitalisation.
Relative strength against BTC.
Spot analysis helps explain the broader price structure and market demand.
Futures market analysis
Futures markets allow traders to take leveraged long or short positions.
Even if an analyst does not trade futures, futures data can provide useful information about market positioning.
Important indicators include:
Funding rates: These help show the relative cost of holding long and short perpetual futures positions. Persistently extreme positive funding can indicate crowded long positioning, while extremely negative funding can indicate crowded short positioning.
Open interest: This measures outstanding derivatives contracts. A rise in open interest indicates that more positions are open, but it does not independently reveal whether the market is bullish or bearish.
Liquidations: These occur when leveraged positions are forcibly closed. Large liquidation events can indicate excessive leverage and sudden market stress.
Long/short positioning: This can provide additional information about market sentiment, although exchange-specific ratios do not represent the entire market.
Important: Futures indicators should be used as supporting evidence, not standalone buy or sell signals.
9. How to Build a More Reliable Market Analysis
A professional crypto analyst should avoid making conclusions from a single indicator.
For example, suppose:
BTC Dominance is declining.
ETH/BTC is rising.
SOL/BTC is rising.
TOTAL3 is increasing.
Altcoin trading volume is expanding.
These indicators together provide stronger evidence of improving altcoin market conditions than BTC Dominance alone.
But if BTC Dominance declines while altcoin prices and volume remain weak, the signal is less convincing.
A good analysis should always include:
The current market structure.
The indicators supporting the analysis.
Bullish and bearish possibilities.
The conditions that would invalidate the analysis.
Risks and uncertainties.
This approach is more useful than making unsupported price predictions.
10. Final Conclusion: Watch Bitcoin, Ethereum and Solana Together
Bitcoin Dominance is an important tool for understanding cryptocurrency market rotation, but it should never be treated as a standalone prediction indicator.
Bitcoin provides a broad view of market direction.
Ethereum helps us evaluate the relative strength of a major smart-contract ecosystem.
Solana provides another perspective through its relative price performance and expanding blockchain ecosystem.
For a more complete market outlook, I would monitor:
BTC price and Bitcoin Dominance.
ETH/BTC relative strength.
SOL/BTC relative strength.
SOL/ETH relative strength.
TOTAL2 and TOTAL3.
Spot trading volume.
Futures funding rates and open interest.
Stablecoin activity and market liquidity.
The next altcoin season should not be declared simply because Bitcoin Dominance falls.
It should be evaluated through sustained relative strength, expanding market participation and improving activity across multiple cryptocurrency ecosystems.
#Bitcoin #Ethereum #Solana #AltcoinSeason #CryptoAnalysis
What do you think?
Which cryptocurrency do you believe has the strongest potential to lead the next major altcoin expansion: Ethereum or Solana?
Do you think Bitcoin Dominance will decline before the next altcoin season?
Share your analysis in the comments.
Disclaimer: This article is for educational and informational purposes only. It does not constitute financial or investment advice. All numerical price and market-cap examples are hypothetical and are not current market data. Cryptocurrency markets are highly volatile. Always conduct independent research before making financial decisions.