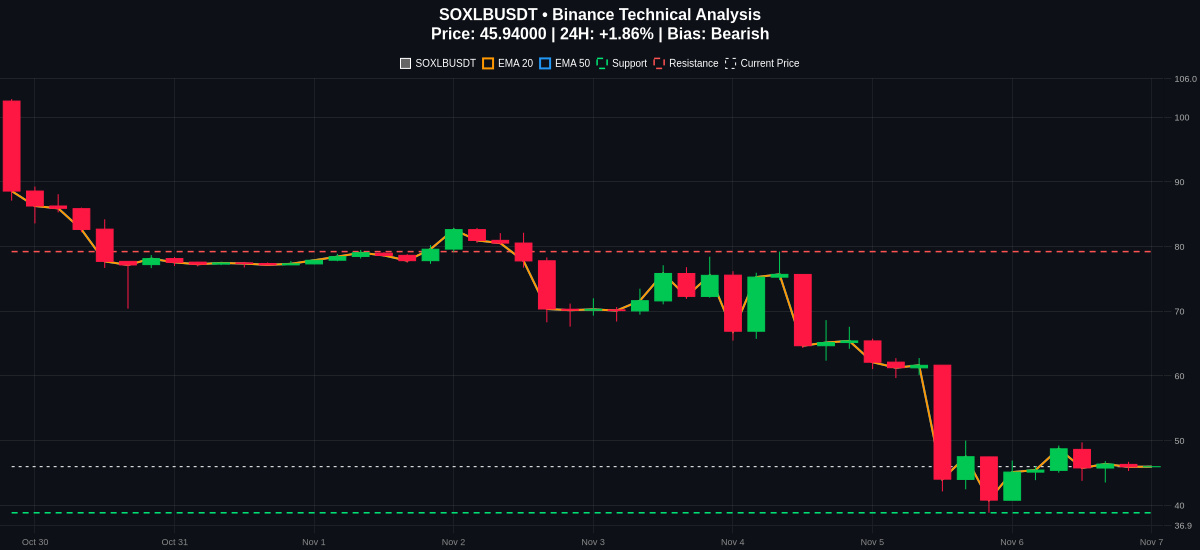
$SOXL is trading near 45.94 with a 24H gain of 1.86%, but the broader market structure remains under heavy pressure.
The technical setup shows price action well below the key moving averages, with the EMA20 sitting at 54.60 and the EMA50 at 66.30. This distance highlights a pronounced downtrend.
On the momentum side, the RSI prints at 33.93, indicating oversold conditions. However, oversold readings alone do not guarantee a reversal and can persist during strong moves. Meanwhile, the MACD line at -7.93 remains below the signal line at -7.73, confirming ongoing bearish momentum without signs of a bullish cross yet.
Key levels to watch include immediate support at 38.81 and major resistance up near 79.19. If downside pressure resumes, a break below support could invalidate current consolidation attempts. Trade cautiously and manage your risk accordingly.
Where do you think $SOXL finds a true bottom before attempting a recovery?
Follow me for more update 📈
#SOXL #CryptoAnalysis #TechnicalSetup
The technical setup shows price action well below the key moving averages, with the EMA20 sitting at 54.60 and the EMA50 at 66.30. This distance highlights a pronounced downtrend.
On the momentum side, the RSI prints at 33.93, indicating oversold conditions. However, oversold readings alone do not guarantee a reversal and can persist during strong moves. Meanwhile, the MACD line at -7.93 remains below the signal line at -7.73, confirming ongoing bearish momentum without signs of a bullish cross yet.
Key levels to watch include immediate support at 38.81 and major resistance up near 79.19. If downside pressure resumes, a break below support could invalidate current consolidation attempts. Trade cautiously and manage your risk accordingly.
Where do you think $SOXL finds a true bottom before attempting a recovery?
Follow me for more update 📈
#SOXL #CryptoAnalysis #TechnicalSetup