SIREN Edges Up 2% as Price Consolidates Around Key Moving Averages
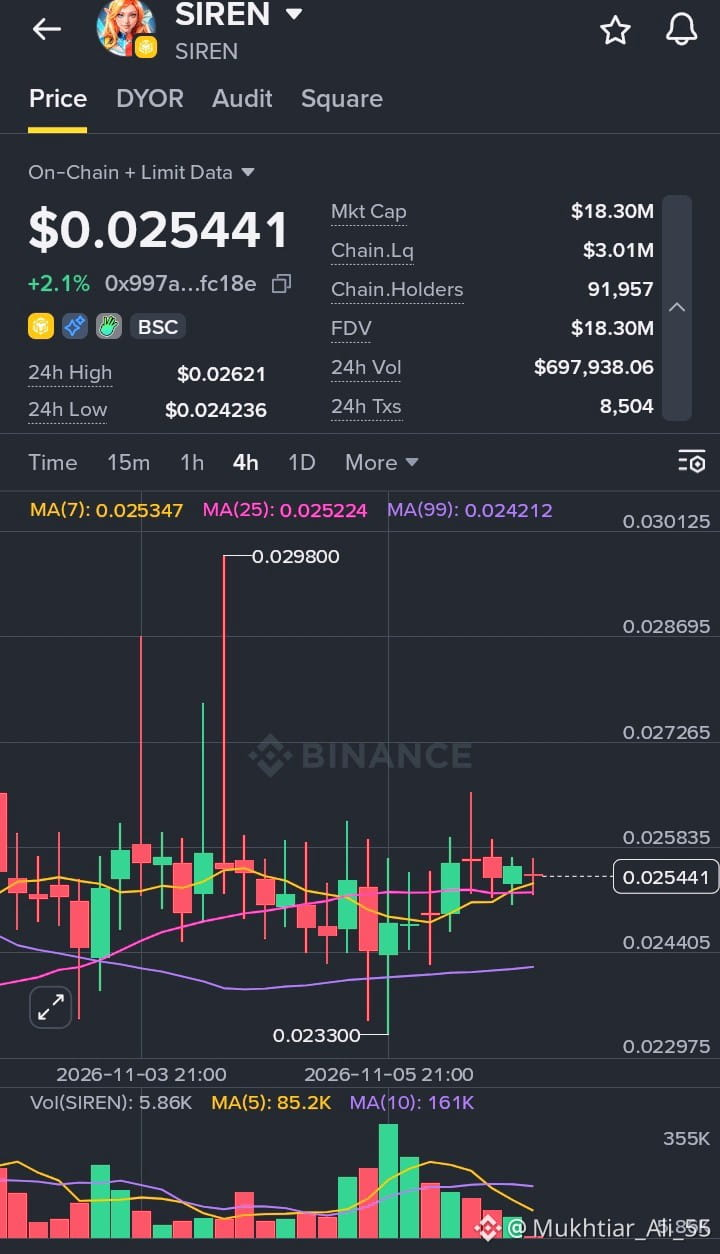
SIREN is trading at $0.025441, up 2.1% over the last 24 hours. After a volatile few days that included a sharp spike, the price has settled into a tight range and is moving sideways right on top of its short-term trend lines.
The numbers at a glance:
24h High: $0.02621
24h Low: $0.024236
Market Cap: $18.30M
Fully Diluted Valuation: $18.30M
24h Volume: $697,938.06
On-chain Liquidity: $3.01M
On-chain Holders: 91,957
24h Transactions: 8,504
What the 4-hour chart shows:
SIREN printed a sharp wick up to $0.0298 earlier in the week and a low of $0.0233, but the price has since compressed into a narrow band between roughly $0.0244 and $0.0258. It is now sitting almost exactly on the MA(7) at 0.025347 and the MA(25) at 0.025224, with the MA(99) at 0.024212 just below, curving gently upward. When price and all three averages sit this close together, it usually signals a market in balance, waiting for a catalyst to pick a direction.
Volume has been fading over the last several sessions, and the latest candles are small with mixed colors. That points to low conviction on both sides for now.
Things worth keeping in mind:
Market cap and FDV are identical at $18.30M, which means the full supply is already in circulation and there is no future unlock pressure to factor in. On-chain liquidity of about $3.01M is healthy relative to the $697K in daily volume, and a holder base of nearly 92,000 shows broad participation. The long wicks seen earlier in the week are a reminder that sudden spikes can happen even when conditions look quiet.
The levels to watch are the $0.0262 daily high on the upside and the MA(99) near $0.0242 on the downside. A decisive break of either side of this range would likely set the next move. As always, do your own research and manage your risk.
$SIREN
SIREN is trading at $0.025441, up 2.1% over the last 24 hours. After a volatile few days that included a sharp spike, the price has settled into a tight range and is moving sideways right on top of its short-term trend lines.
The numbers at a glance:
24h High: $0.02621
24h Low: $0.024236
Market Cap: $18.30M
Fully Diluted Valuation: $18.30M
24h Volume: $697,938.06
On-chain Liquidity: $3.01M
On-chain Holders: 91,957
24h Transactions: 8,504
What the 4-hour chart shows:
SIREN printed a sharp wick up to $0.0298 earlier in the week and a low of $0.0233, but the price has since compressed into a narrow band between roughly $0.0244 and $0.0258. It is now sitting almost exactly on the MA(7) at 0.025347 and the MA(25) at 0.025224, with the MA(99) at 0.024212 just below, curving gently upward. When price and all three averages sit this close together, it usually signals a market in balance, waiting for a catalyst to pick a direction.
Volume has been fading over the last several sessions, and the latest candles are small with mixed colors. That points to low conviction on both sides for now.
Things worth keeping in mind:
Market cap and FDV are identical at $18.30M, which means the full supply is already in circulation and there is no future unlock pressure to factor in. On-chain liquidity of about $3.01M is healthy relative to the $697K in daily volume, and a holder base of nearly 92,000 shows broad participation. The long wicks seen earlier in the week are a reminder that sudden spikes can happen even when conditions look quiet.
The levels to watch are the $0.0262 daily high on the upside and the MA(99) near $0.0242 on the downside. A decisive break of either side of this range would likely set the next move. As always, do your own research and manage your risk.
$SIREN