BNB Attestation (BAS) Rallies Over 10% After a Sharp Dip, Faces Resistance Near $0.016
BNB Attestation (BAS) is trading at $0.015121, up 10.45% over the last 24 hours. After a steep sell-off earlier in the session, buyers stepped in with force and pushed the price back above its short-term moving averages.
The numbers at a glance:
24h High: $0.01609
24h Low: $0.0134
Market Cap: $72.39M
Fully Diluted Valuation: $151.22M
24h Volume: $1.48M
On-chain Liquidity: $1.56M
On-chain Holders: 167,739
24h Transactions: 10,738
What the 4-hour chart shows:
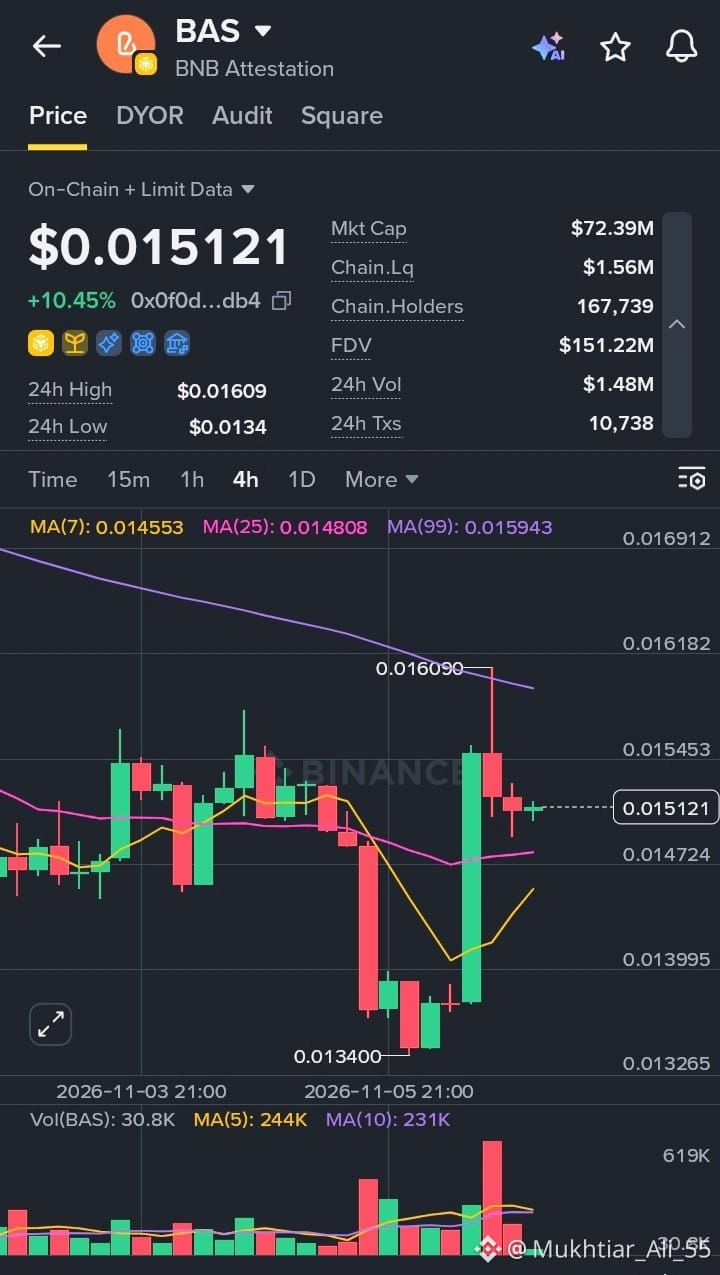
BAS dropped to a low of $0.0134 before a large green candle drove it all the way up to $0.01609. That push was rejected by the MA(99) at 0.015943, leaving a long upper wick, and the price has since settled back near $0.0151. It is currently sitting above the MA(7) at 0.014553 and the MA(25) at 0.014808, with the MA(7) curving upward. The MA(99) is still sloping down overhead, so the broader trend has not fully flipped bullish yet.
Volume spiked on both the sell-off and the recovery candle, then cooled in the latest sessions. The small, indecisive candles now suggest the market is pausing and deciding its next move.
Things worth keeping in mind:
A holder base of more than 167,000 shows wide participation, but on-chain liquidity of about $1.56M is modest against a $72.39M market cap, so price can swing sharply on larger trades. The gap between market cap and the $151.22M FDV also means future token supply is worth tracking.
The key upside level is the $0.0159 to $0.0161 zone, where the MA(99) and the recent wick high meet. On the downside, the MA(25) near $0.0148 is the area buyers will want to defend. As always, do your own research and manage your risk.
$BAS
BNB Attestation (BAS) is trading at $0.015121, up 10.45% over the last 24 hours. After a steep sell-off earlier in the session, buyers stepped in with force and pushed the price back above its short-term moving averages.
The numbers at a glance:
24h High: $0.01609
24h Low: $0.0134
Market Cap: $72.39M
Fully Diluted Valuation: $151.22M
24h Volume: $1.48M
On-chain Liquidity: $1.56M
On-chain Holders: 167,739
24h Transactions: 10,738
What the 4-hour chart shows:
BAS dropped to a low of $0.0134 before a large green candle drove it all the way up to $0.01609. That push was rejected by the MA(99) at 0.015943, leaving a long upper wick, and the price has since settled back near $0.0151. It is currently sitting above the MA(7) at 0.014553 and the MA(25) at 0.014808, with the MA(7) curving upward. The MA(99) is still sloping down overhead, so the broader trend has not fully flipped bullish yet.
Volume spiked on both the sell-off and the recovery candle, then cooled in the latest sessions. The small, indecisive candles now suggest the market is pausing and deciding its next move.
Things worth keeping in mind:
A holder base of more than 167,000 shows wide participation, but on-chain liquidity of about $1.56M is modest against a $72.39M market cap, so price can swing sharply on larger trades. The gap between market cap and the $151.22M FDV also means future token supply is worth tracking.
The key upside level is the $0.0159 to $0.0161 zone, where the MA(99) and the recent wick high meet. On the downside, the MA(25) near $0.0148 is the area buyers will want to defend. As always, do your own research and manage your risk.
$BAS