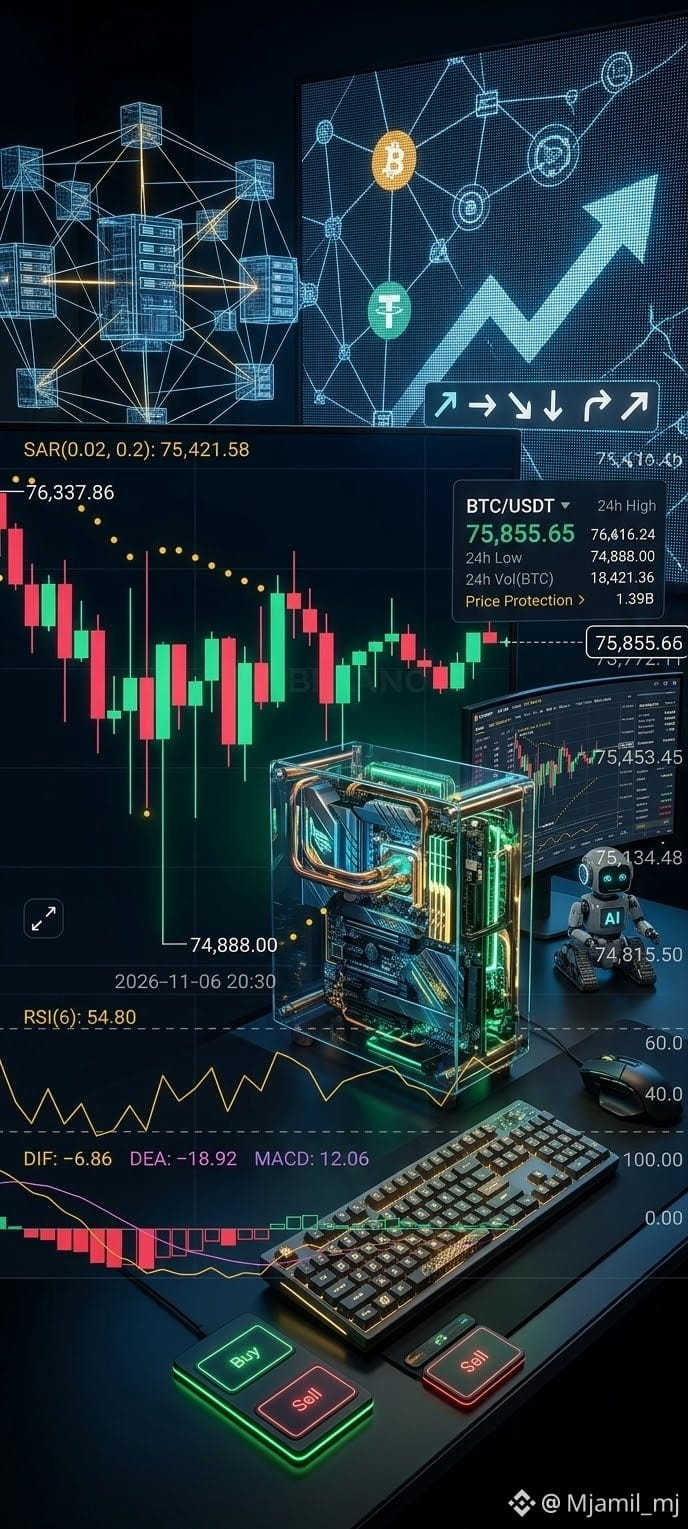
A main candlestick chart details the price movement of the Bitcoin and Tether pair (BTC/USDT), showing fluctuations with price labels and various data points in green and red. The primary price displayed is 75,855.65, with a 24-hour high of 76,416.24 and low of 74,888.00. Beneath this, additional charts track specific technical analysis tools: the Relative Strength Index (RSI) at 54.80 and the Moving Average Convergence Divergence (MACD) with its signal lines and histogram.
The complex computer rig is the central element of the lower composition, featuring intricate copper tubes and internal LED lighting that gives it a futuristic appearance. It is set upon a dark desk surface alongside specialized input devices, including a mechanical keyboard and two larger custom buttons marked "Buy" and "Sell," illuminated in bright green and red. A small robotic AI assistant figure stands nearby. The background is dominated by large-scale screens featuring network graphics and arrows indicating market trends, suggesting an advanced data center or trading room dedicated to quantitative analysis. The image is rendered with a detailed, technological aesthetic, emphasizing the connection between hardware and market activity.
$BTC
The complex computer rig is the central element of the lower composition, featuring intricate copper tubes and internal LED lighting that gives it a futuristic appearance. It is set upon a dark desk surface alongside specialized input devices, including a mechanical keyboard and two larger custom buttons marked "Buy" and "Sell," illuminated in bright green and red. A small robotic AI assistant figure stands nearby. The background is dominated by large-scale screens featuring network graphics and arrows indicating market trends, suggesting an advanced data center or trading room dedicated to quantitative analysis. The image is rendered with a detailed, technological aesthetic, emphasizing the connection between hardware and market activity.
$BTC