$BTC.D Market Update
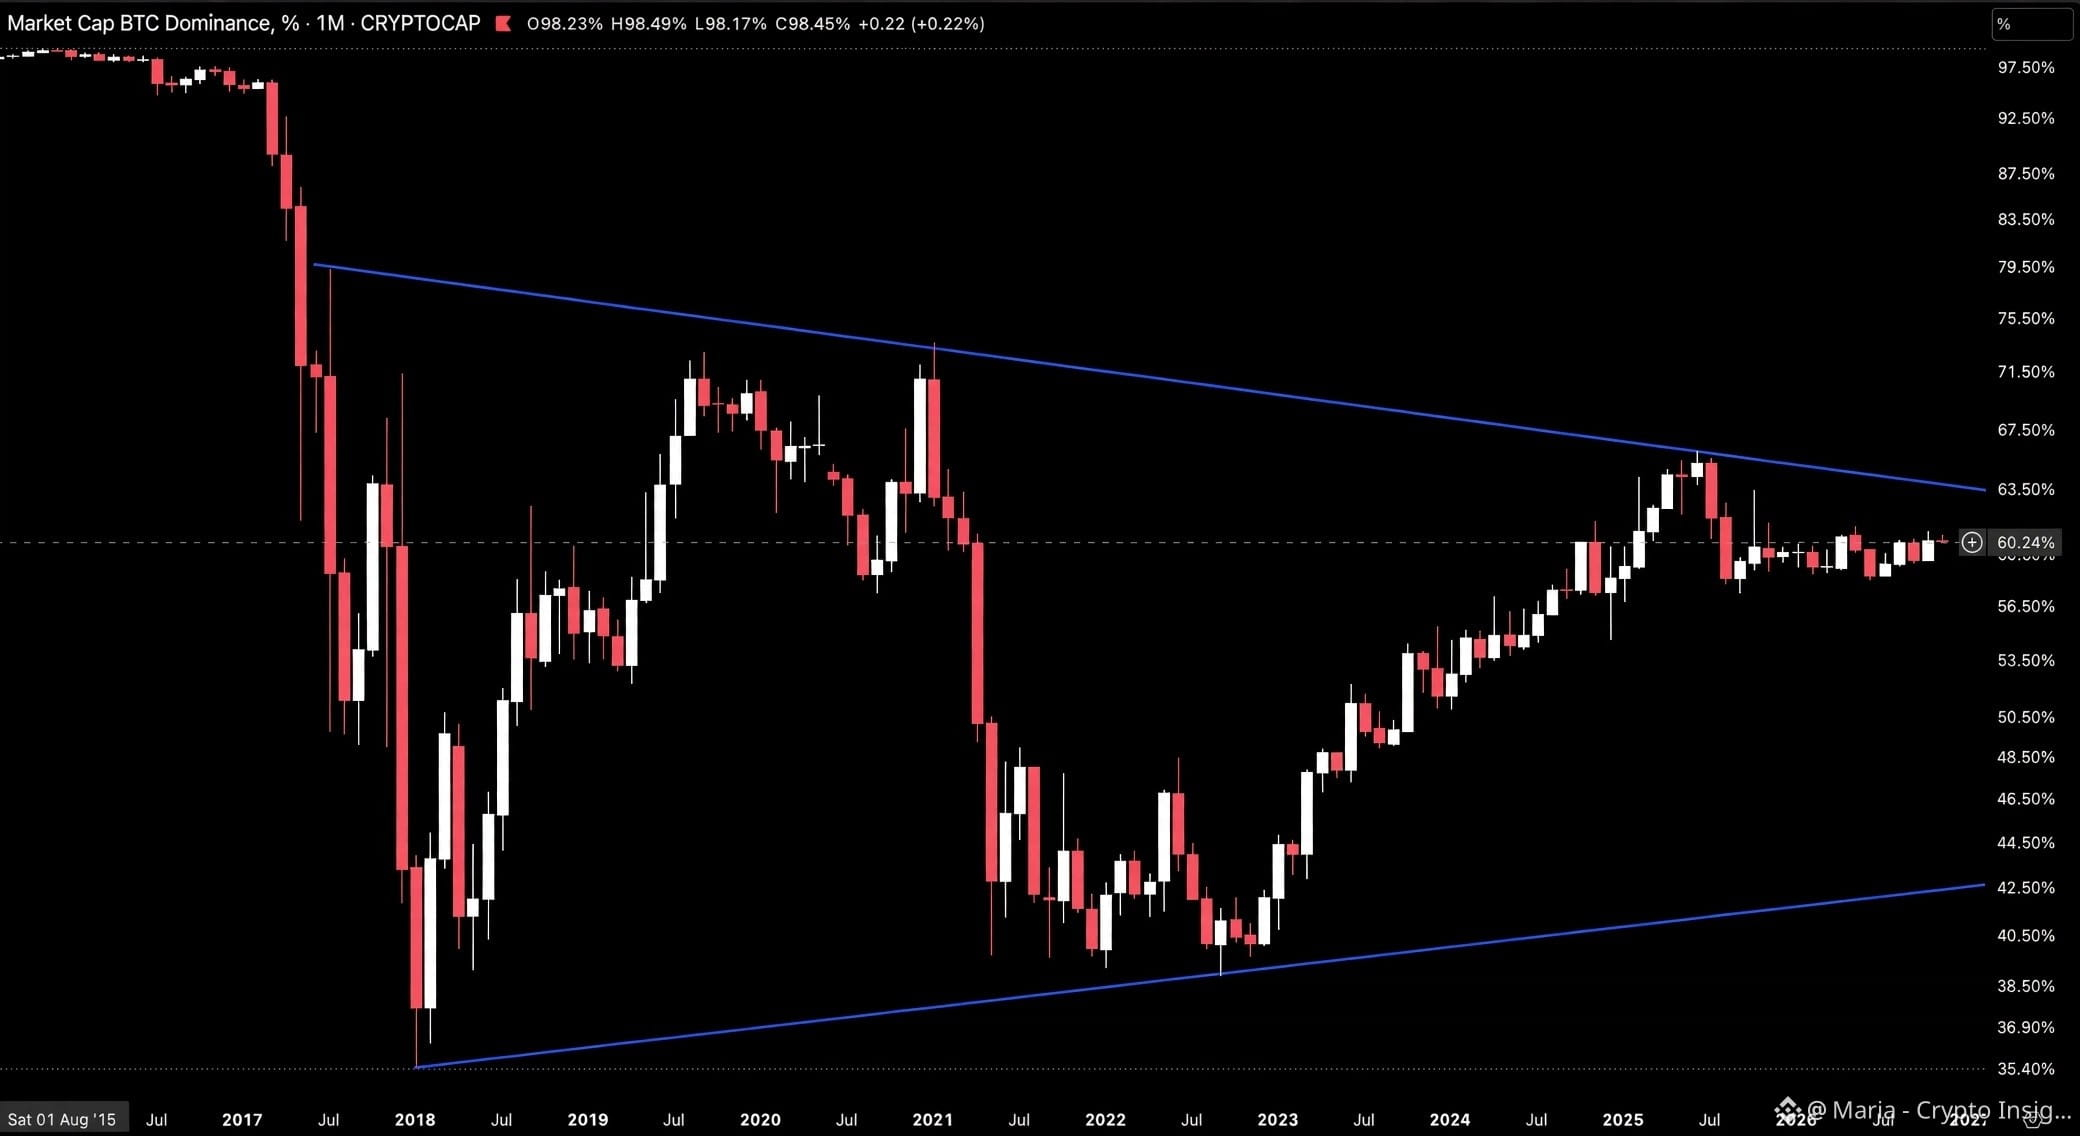
From a macro view, BTC.D is trading at 60.24% inside a symmetrical triangle on the monthly that has been forming since 2017, after being rejected from the descending trendline near 66% in 2025, with the rising trendline from the 2018 low sitting near 42.50%.
If this pattern holds, dominance could move toward 53.50% to 50.50% over the coming months, with the rising trendline near 42.50% as the macro target, and that would favor a major altcoin rotation. A monthly close above 63.50% invalidates the setup and extends BTC control.
This is not financial advice. DYOR.
From a macro view, BTC.D is trading at 60.24% inside a symmetrical triangle on the monthly that has been forming since 2017, after being rejected from the descending trendline near 66% in 2025, with the rising trendline from the 2018 low sitting near 42.50%.
If this pattern holds, dominance could move toward 53.50% to 50.50% over the coming months, with the rising trendline near 42.50% as the macro target, and that would favor a major altcoin rotation. A monthly close above 63.50% invalidates the setup and extends BTC control.
This is not financial advice. DYOR.