



SUI has a pending buy signal on the 12-hour chart after finding support at target four and the 200-day moving average.
Price has reclaimed the yellow indicator line, but the daily chart still lacks a corresponding pending buy signal.
Binance leads exchange volume at $38.04 million, while Coinbase records the largest positive net inflow at $2.33 million.
SUI buy signal is drawing attention after price recovered from its recent support area and moved above the yellow indicator line. The daily chart, however, still lacks confirmation.
SUI's 12-hour chart shows an early recovery
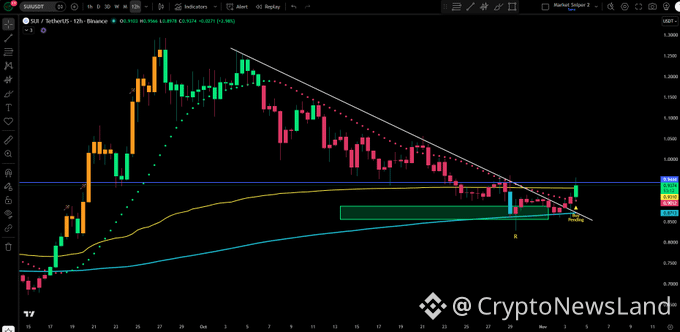
Jesse Olson reported a pending buy signal on SUI's 12-hour chart. His assessment points to support at target four and the 200-day simple moving average. He also noted that the price had climbed back above the yellow line.
 Source: X
The chart shows a prolonged decline after SUI approached $1.30 during September. Successive lower highs formed beneath a descending trendline throughout October. That pattern kept sellers in control until price reached the green support region.
The shaded area around 0.82–0.87 attracted buyers after the decline. Price then recovered toward the descending trendline, meeting resistance during its initial attempts. The latest bullish candle moved above that boundary and changed the short-term structure.
The yellow indicator line near $0.910 now provides an immediate reference. SUI has reclaimed this level after trading beneath it during October. Holding above it would preserve one condition identified in Olson's pending signal.
Exchange activity shows different volume and flow patterns
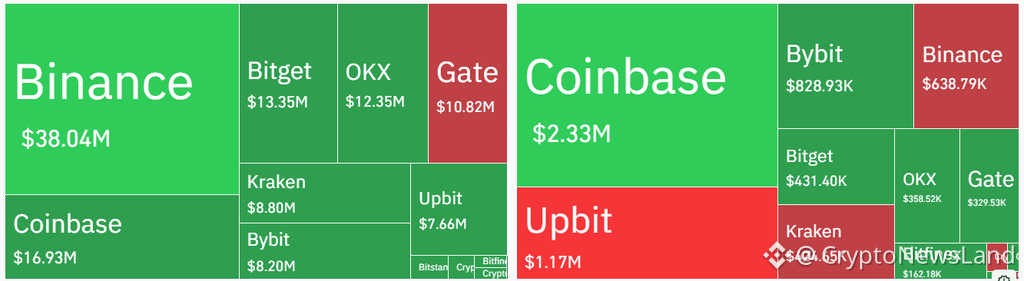
The 24-hour volume heatmap records Binance at $38.04 million. Bitget sits in second place with $13.35 million, followed by Coinbase at $16.93 million. The others are OKX, Gate, Kraken and Bybit, reporting $12.35 million, $10.82 million, $8.80 million and $8.20 million, respectively.
 Source: Coinglass
The net inflow heatmap produces a different ranking across exchanges. Coinbase leads with positive inflows of $2.33 million, followed by Bybit at $828,930. Bitget records $431,400, while OKX and Gate show $358,520 and $329,530.
Upbit records the largest displayed net outflow at $1.17 million. Binance follows with a negative $638,790, while Kraken records an outflow of $424,650. These figures show that high trading volume does not necessarily coincide with positive net inflows.
Binance's position illustrates that difference particularly clearly. It leads the volume table but records a negative net flow. Coinbase, on the other hand, ranks as the second highest volume with the highest inflows.
Price levels determine whether the setup develops further
The SUI is up 1% to $0.9232 in the latest 24-hour market data provided. Volume is close to $393.69 million, and market cap is around $3.821 billion. Perpetual futures open interest is close to $999.28 million.
This is the first level of resistance at $0.944 on the prior chart. A prolonged close over that would give the recovery a boost. Next visible references are around $0.98 and the $1.00 mark in the minds of traders.
The yellow line near $0.910 is the first support level, if the price falls below that level. Another marked level sits around $0.891, followed by the rising cyan average near $0.871. A deeper decline could bring the green demand zone between $0.82 and $0.87 back into view.
Intradyan chart resistance has also been seen in the recent period at 0.94-0.95 SUI, where the price had been hovering around $0.952 prior to its retreat into a tight range. It then failed to sustain any gains above $0.93 and ultimately fell back to the $0.92 to $0.94 range.
The distinction between timeframes remains central to the setup. The 12-hour chart carries a pending buy signal after support at target four and the 200-day average. The daily chart has no matching signal, leaving the broader reversal unconfirmed. Holding above the yellow line and clearing $0.944 would provide further evidence of continued buying strength.