

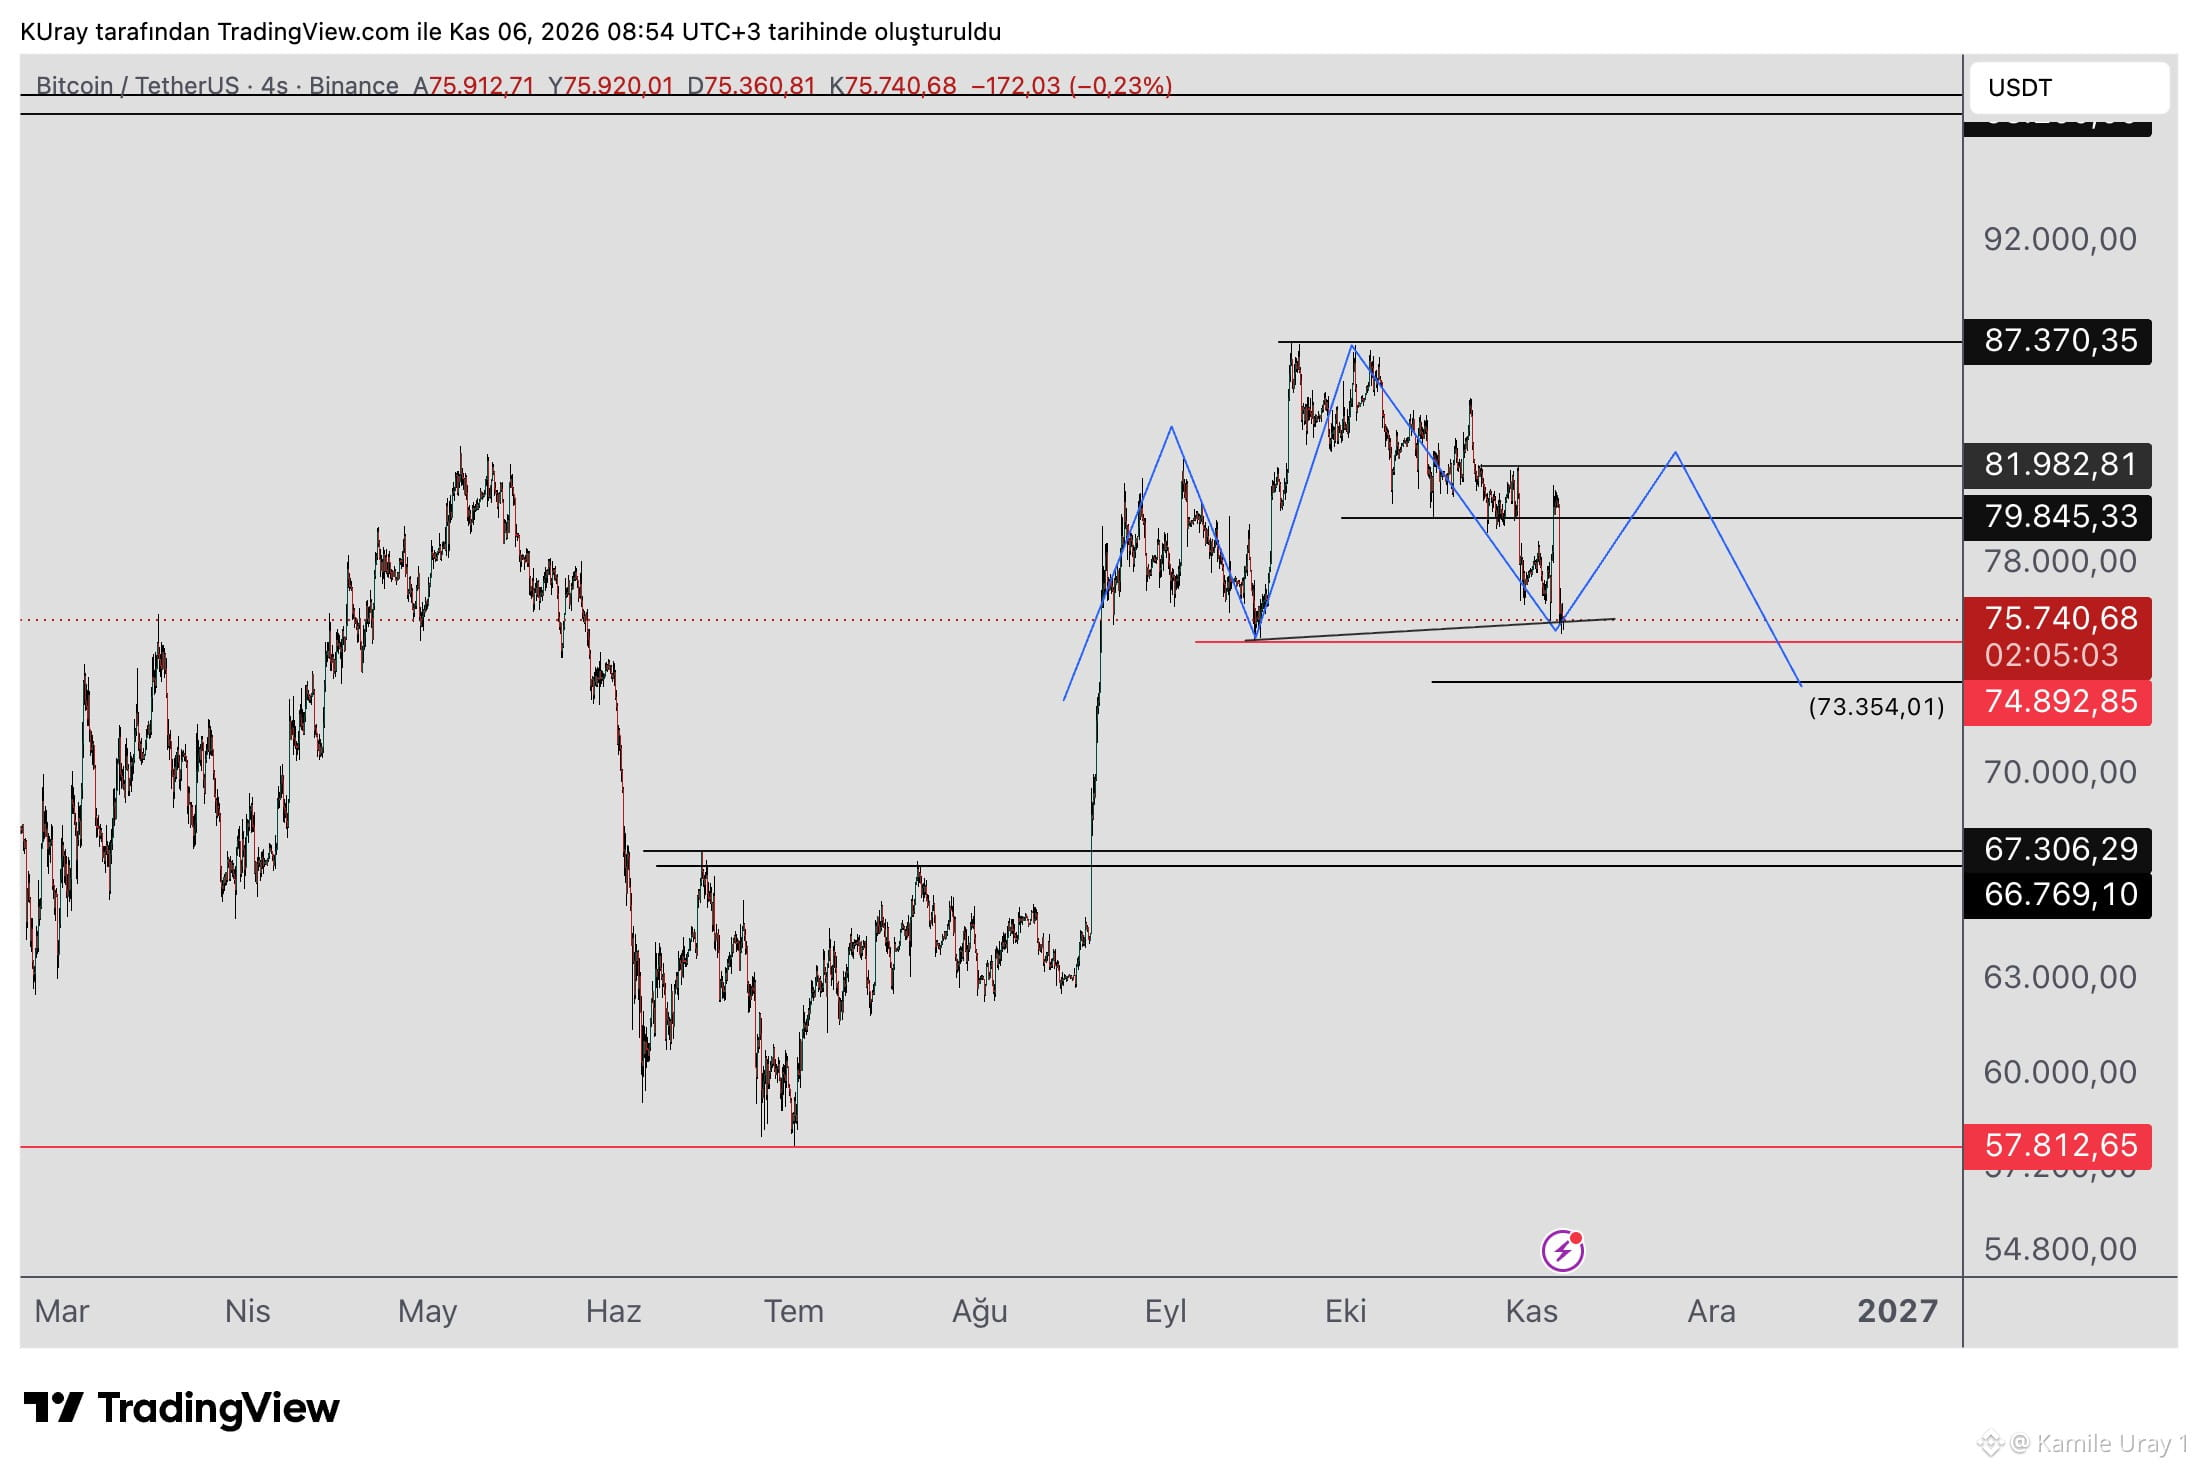
The rally in #BTC yesterday was short-lived, followed by a sharp sell-off across all markets. As previously discussed, the recent rise appears to be merely a corrective bounce within a broader downtrend; our outlook remains unchanged. The structure—marked in blue—still appears to be completing the "shoulder" of a Head and Shoulders (H&S) pattern. If the price fails to close above 81,982, the rally should be viewed as a corrective bounce, and the downward trend may continue. A daily close below 74,892 would activate the H&S pattern, signaling further declines with a target in the 66,000–67,000 range. It is important to note that declines rarely occur in a straight line; intermittent upward bounces—acting as reactions to the downward movement—are to be expected. Key support levels to monitor are 74,892, followed by 73,354, 67,306, and 66,769. The 74,892 level is critical during this decline; if it holds on a daily timeframe, a "lower low" (relative to the most recent downward wave) will not be established, potentially allowing for an upward move before the pattern’s target is reached.
Krypto-Nutzer weltweit auf Binance Square kennenlernen
⚡️ Bleib in Sachen Krypto stets am Puls.
💬 Die weltgrößte Kryptobörse vertraut darauf.
👍 Erhalte verlässliche Einblicke von verifizierten Creators.
E-Mail-Adresse/Telefonnummer