**Free indicator: Lina RSI is now on TradingView**
Most traders use RSI only for overbought / oversold. Lina RSI reads it as waves, so trend, pullbacks and exhaustion are visible at a glance.
What you get:
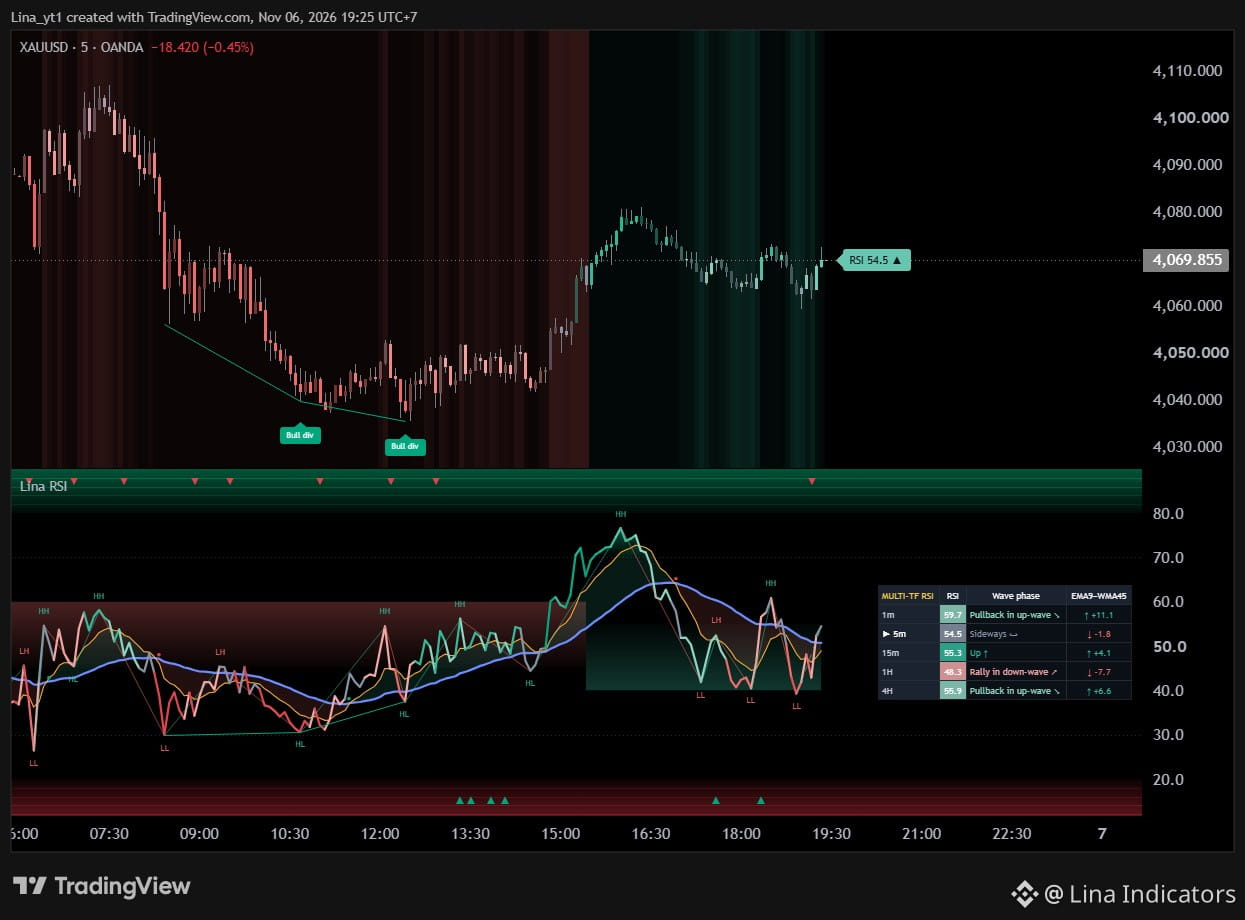
• 7-phase RSI line, from strong up to strong down
• Trend pullback band where with-trend entries usually form
• Smooth extreme-zone fill
• RSI zigzag with HH / HL / LH / LL labels
• Regular divergence on RSI and price
• Pullback completed / failed marks
• Candle colors and trend background on the price chart
• Auto 5-timeframe RSI table
• 6 alerts
How to use it: green candles = look for longs, red = look for shorts. Wait for RSI to pull back into the band and complete before joining the trend. Don't chase in the extreme zone.
100% free. No sign-up, no conditions.
→ tradingview.com/script/qFbYduhk-Lina-RSI-Wave-Phase-RSI-with-Trend-Pullback-Zones/
$BTC $ETH #Gold #TradingView #RSI #TechnicalAnalysis
Not financial advice. Always manage your risk.
Most traders use RSI only for overbought / oversold. Lina RSI reads it as waves, so trend, pullbacks and exhaustion are visible at a glance.
What you get:
• 7-phase RSI line, from strong up to strong down
• Trend pullback band where with-trend entries usually form
• Smooth extreme-zone fill
• RSI zigzag with HH / HL / LH / LL labels
• Regular divergence on RSI and price
• Pullback completed / failed marks
• Candle colors and trend background on the price chart
• Auto 5-timeframe RSI table
• 6 alerts
How to use it: green candles = look for longs, red = look for shorts. Wait for RSI to pull back into the band and complete before joining the trend. Don't chase in the extreme zone.
100% free. No sign-up, no conditions.
→ tradingview.com/script/qFbYduhk-Lina-RSI-Wave-Phase-RSI-with-Trend-Pullback-Zones/
$BTC $ETH #Gold #TradingView #RSI #TechnicalAnalysis
Not financial advice. Always manage your risk.