LAB Rebounds Nearly 8% After a Sharp Dip: What the 4H Chart Shows
LAB is bouncing back. The token is trading at $0.04675, up 7.78% over the last 24 hours, with a high of $0.050165 and a low of $0.040102.
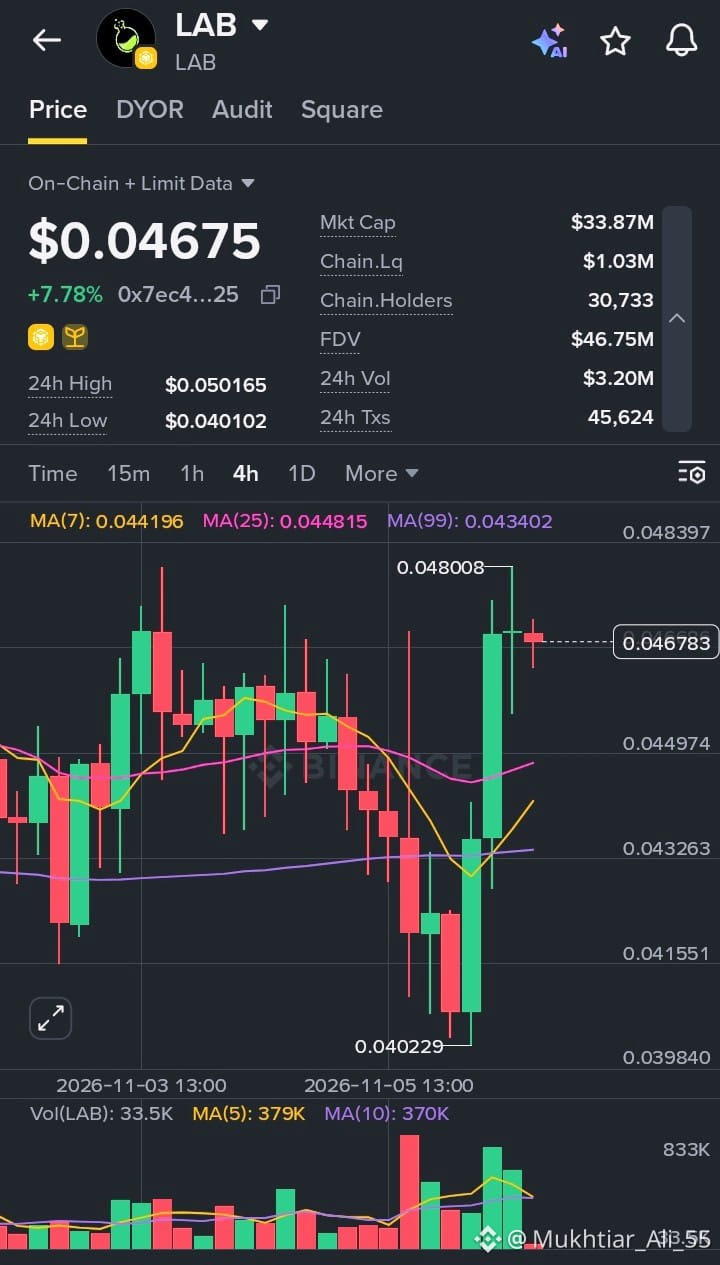
The 4H chart tells a story of a drop followed by a strong recovery. Price slid through the middle of the range and bottomed near $0.040229, then buyers stepped in with a sequence of strong green candles that pushed it back up to a recent high of $0.048008. The latest candle is a small red one near $0.0468, which looks like a brief pause after a fast move rather than a reversal.
Key numbers at a glance:
Market Cap: $33.87M
FDV: $46.75M
24h Volume: $3.20M
24h Transactions: 45,624
On-chain Holders: 30,733
On-chain Liquidity: $1.03M
Price has moved back above the MA(7) at 0.044196, MA(25) at 0.044815 and MA(99) at 0.043402, which is a constructive sign after the earlier dip below them. The MA(7) is now curling upward and approaching the MA(25), so a bullish crossover could be forming if momentum holds. Volume was heavy on the selloff and again on the rebound, which shows both sides were active, but the most recent bar is light, so follow-through still needs confirmation.
The area around $0.048 to $0.050 is the next test, since sellers rejected price there earlier. On the downside, the $0.0448 to $0.0442 zone, where the moving averages cluster, is the first area to watch for support. With liquidity at about $1.03M against a $33.87M market cap, price can move quickly in either direction.
If you’re tracking LAB, it may be better to wait for a clean break above $0.048 on rising volume, or a calm retest of the moving averages, instead of chasing the bounce. Keep your risk in check and only commit what you can afford to lose. This is not financial advice, just my read of the chart.
#LAB #CryptoAnalysis #BinanceSquare #PriceAction #AltcoinWatch
$LAB
LAB is bouncing back. The token is trading at $0.04675, up 7.78% over the last 24 hours, with a high of $0.050165 and a low of $0.040102.
The 4H chart tells a story of a drop followed by a strong recovery. Price slid through the middle of the range and bottomed near $0.040229, then buyers stepped in with a sequence of strong green candles that pushed it back up to a recent high of $0.048008. The latest candle is a small red one near $0.0468, which looks like a brief pause after a fast move rather than a reversal.
Key numbers at a glance:
Market Cap: $33.87M
FDV: $46.75M
24h Volume: $3.20M
24h Transactions: 45,624
On-chain Holders: 30,733
On-chain Liquidity: $1.03M
Price has moved back above the MA(7) at 0.044196, MA(25) at 0.044815 and MA(99) at 0.043402, which is a constructive sign after the earlier dip below them. The MA(7) is now curling upward and approaching the MA(25), so a bullish crossover could be forming if momentum holds. Volume was heavy on the selloff and again on the rebound, which shows both sides were active, but the most recent bar is light, so follow-through still needs confirmation.
The area around $0.048 to $0.050 is the next test, since sellers rejected price there earlier. On the downside, the $0.0448 to $0.0442 zone, where the moving averages cluster, is the first area to watch for support. With liquidity at about $1.03M against a $33.87M market cap, price can move quickly in either direction.
If you’re tracking LAB, it may be better to wait for a clean break above $0.048 on rising volume, or a calm retest of the moving averages, instead of chasing the bounce. Keep your risk in check and only commit what you can afford to lose. This is not financial advice, just my read of the chart.
#LAB #CryptoAnalysis #BinanceSquare #PriceAction #AltcoinWatch
$LAB