BIRB Surges 32% as Buyers Take Control: A Look at the 4H Chart
Moonbirds (BIRB) is having a strong session. The token is trading at $0.11205, up 32.67% over the last 24 hours, with a high of $0.13359 and a low of $0.084376.
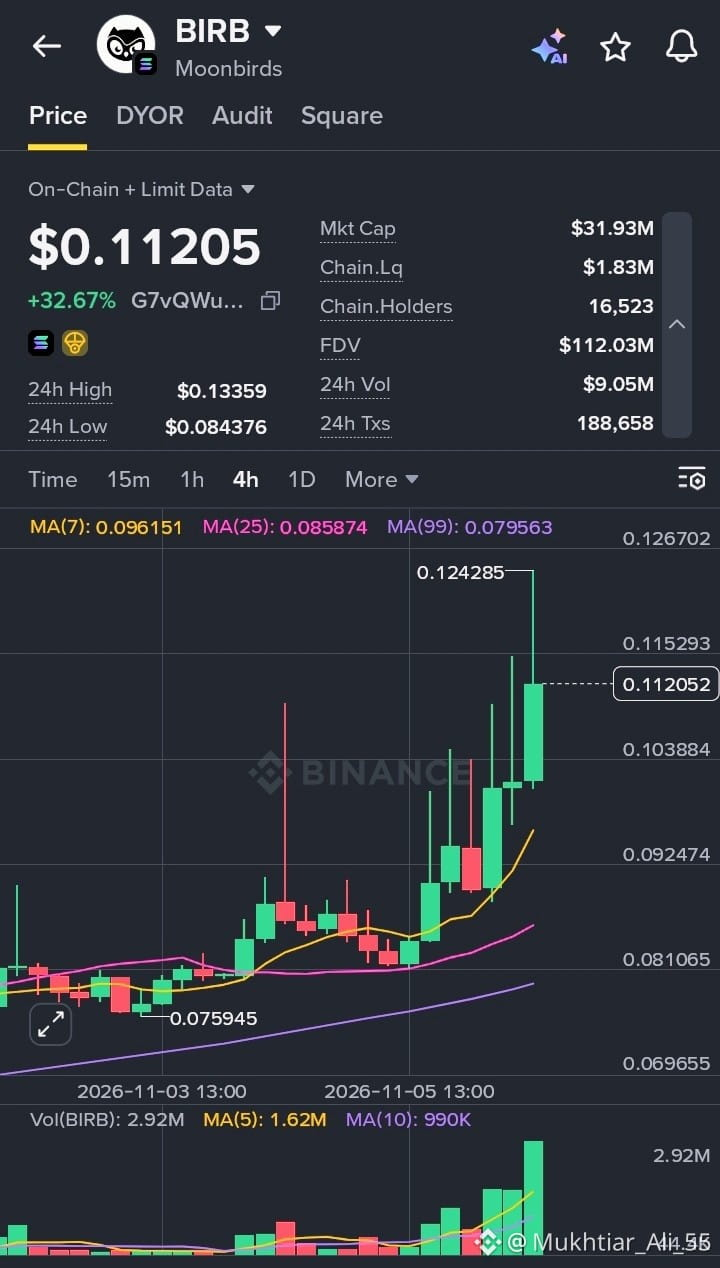
The 4H chart shows a clean, steady climb. After a period of sideways movement in the $0.08 to $0.09 area, price started building higher lows and then accelerated sharply. A recent wick reached $0.124285 before pulling back slightly, but the latest candle closed solidly green, which shows buyers are still defending the move.
Key numbers at a glance:
Market Cap: $31.93M
FDV: $112.03M
24h Volume: $9.05M
24h Transactions: 188,658
On-chain Holders: 16,523
On-chain Liquidity: $1.83M
Price is trading comfortably above the MA(7) at 0.096151, MA(25) at 0.085874 and MA(99) at 0.079563, with all three sloping upward. That alignment is a healthy sign for the short-term trend. Volume has also been rising with each green candle, with the latest bar the largest on the chart, which suggests the rally has real participation behind it rather than a thin pump.
That said, a 32% move in a day often invites profit-taking. The long upper wick near $0.124 shows some sellers stepped in at higher levels, so a pullback toward the MA(7) would not be surprising. Liquidity of $1.83M against a roughly $32M market cap is moderate, so volatility can stay high in both directions.
If you’re watching BIRB, patience is a better ally than chasing green candles. Let price confirm support on any dip, keep position sizes sensible, and never risk more than you can afford to lose. This is not financial advice, just my read of the chart.
#BIRB #Moonbirds #CryptoAnalysis #BinanceSquare #PriceAction
$BIRB
Moonbirds (BIRB) is having a strong session. The token is trading at $0.11205, up 32.67% over the last 24 hours, with a high of $0.13359 and a low of $0.084376.
The 4H chart shows a clean, steady climb. After a period of sideways movement in the $0.08 to $0.09 area, price started building higher lows and then accelerated sharply. A recent wick reached $0.124285 before pulling back slightly, but the latest candle closed solidly green, which shows buyers are still defending the move.
Key numbers at a glance:
Market Cap: $31.93M
FDV: $112.03M
24h Volume: $9.05M
24h Transactions: 188,658
On-chain Holders: 16,523
On-chain Liquidity: $1.83M
Price is trading comfortably above the MA(7) at 0.096151, MA(25) at 0.085874 and MA(99) at 0.079563, with all three sloping upward. That alignment is a healthy sign for the short-term trend. Volume has also been rising with each green candle, with the latest bar the largest on the chart, which suggests the rally has real participation behind it rather than a thin pump.
That said, a 32% move in a day often invites profit-taking. The long upper wick near $0.124 shows some sellers stepped in at higher levels, so a pullback toward the MA(7) would not be surprising. Liquidity of $1.83M against a roughly $32M market cap is moderate, so volatility can stay high in both directions.
If you’re watching BIRB, patience is a better ally than chasing green candles. Let price confirm support on any dip, keep position sizes sensible, and never risk more than you can afford to lose. This is not financial advice, just my read of the chart.
#BIRB #Moonbirds #CryptoAnalysis #BinanceSquare #PriceAction
$BIRB