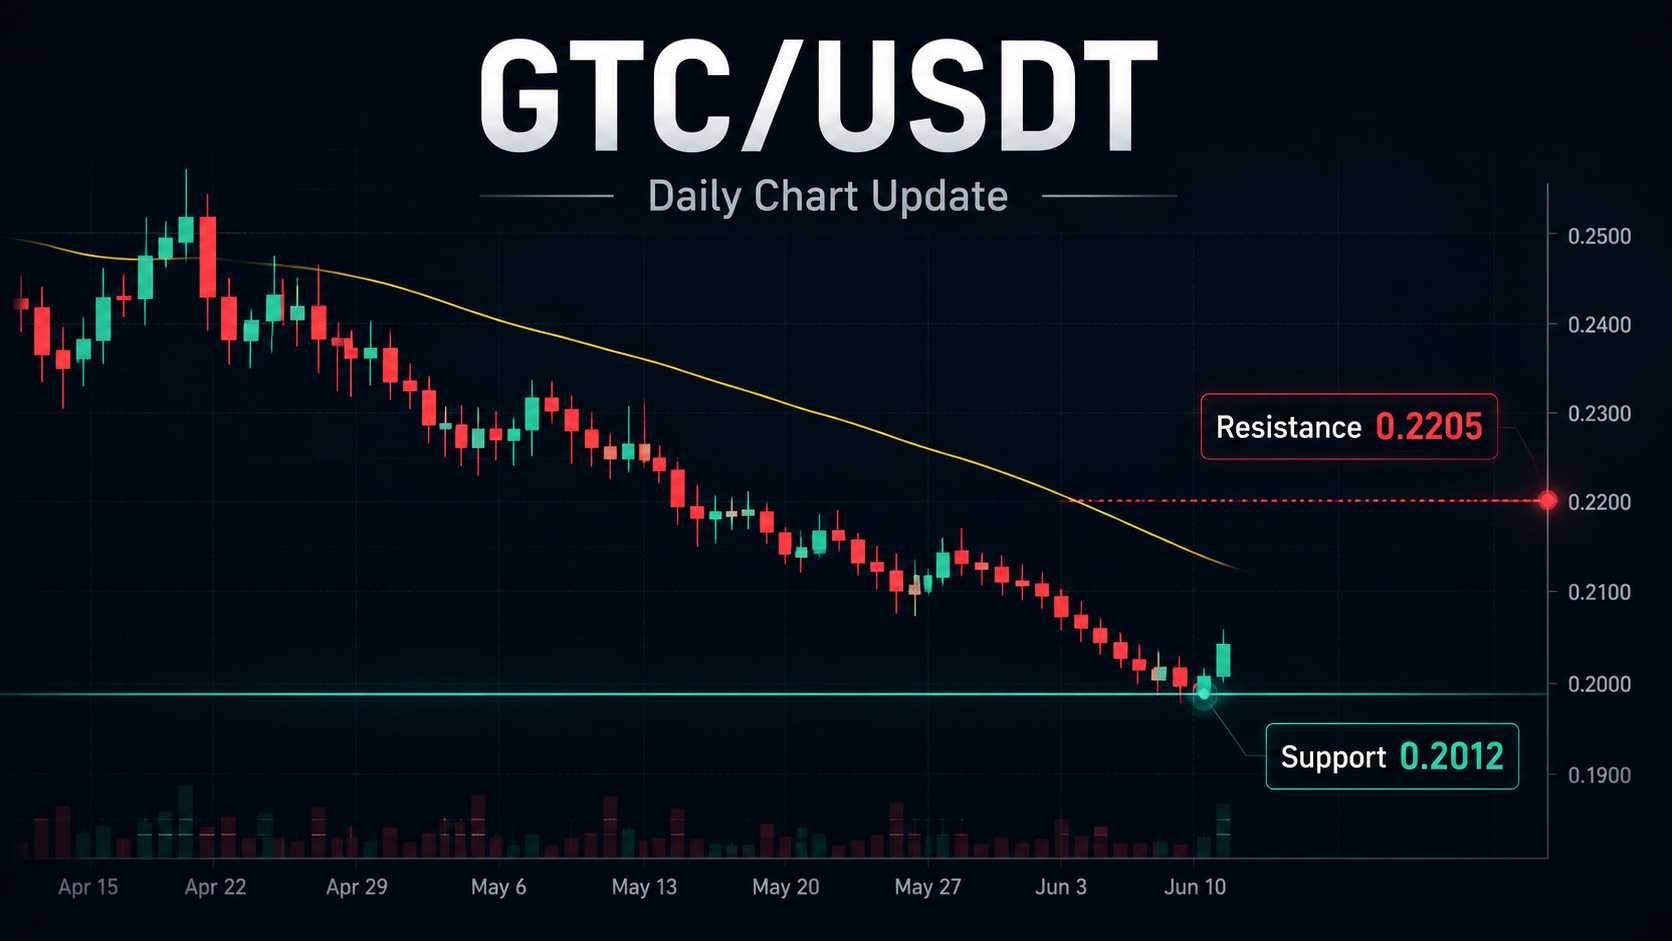
$GTC/USDT | Daily Chart Update
GTC is trading near 0.2156, holding just above the 24h low of 0.2012 after a 7-day pullback of about 10.9%.
Key observations:
- Price is below the MA(7) at 0.2205 and the MA(25) at 0.2428, so short-term momentum remains bearish.
- Parabolic SAR is still above price, which means the downtrend is not yet confirmed as reversed.
- The MA(99) at 0.1349 sits far below, which shows the broader 30-day gain is still intact.
- Order book is slightly bid-heavy at 52%, a sign of mild buyer interest.
Levels to watch:
- Resistance: 0.2205 to 0.2209 (MA7 and the previous rejection zone)
- Support: 0.2012, then 0.1747
A daily close above 0.2205 would be the first sign of strength. Losing 0.2012 could open a retest of lower support.
Patience over prediction. Let the chart confirm.
Not financial advice. Always DYOR.
#GTC #Gitcoin #cryptouniverseofficial #BİNANCESQUARE #TrendingTopic
$GTC
GTC is trading near 0.2156, holding just above the 24h low of 0.2012 after a 7-day pullback of about 10.9%.
Key observations:
- Price is below the MA(7) at 0.2205 and the MA(25) at 0.2428, so short-term momentum remains bearish.
- Parabolic SAR is still above price, which means the downtrend is not yet confirmed as reversed.
- The MA(99) at 0.1349 sits far below, which shows the broader 30-day gain is still intact.
- Order book is slightly bid-heavy at 52%, a sign of mild buyer interest.
Levels to watch:
- Resistance: 0.2205 to 0.2209 (MA7 and the previous rejection zone)
- Support: 0.2012, then 0.1747
A daily close above 0.2205 would be the first sign of strength. Losing 0.2012 could open a retest of lower support.
Patience over prediction. Let the chart confirm.
Not financial advice. Always DYOR.
#GTC #Gitcoin #cryptouniverseofficial #BİNANCESQUARE #TrendingTopic
$GTC