$PAXG: Stability Mechanisms During Local Deviations
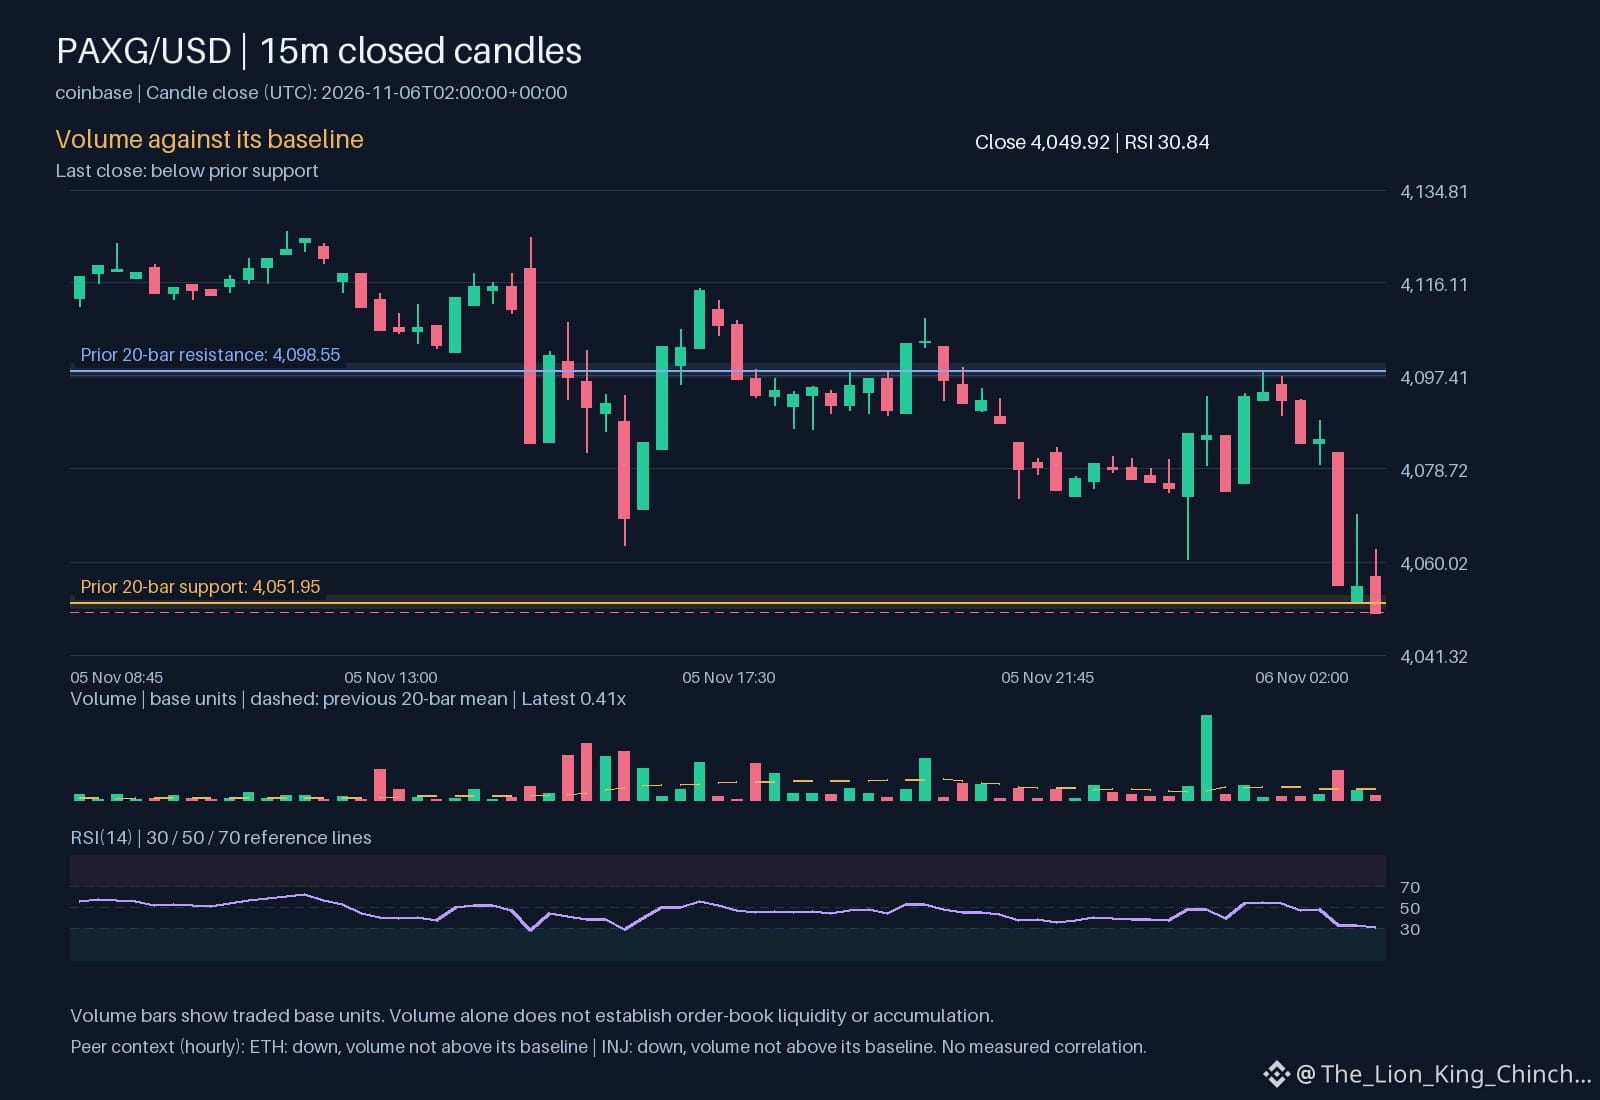
The primary question for $PAXG involves how price interacts with its structural floor. Currently, the asset sits below support at 4051.95 and shows an hourly direction moving down. Trading activity remains quiet, as volume is not above baseline. One mechanism to consider is the liquidity gap; when a price slips below a known floor without a volume spike, it suggests a lack of aggressive sellers but also a temporary absence of buyers. This differs from a high-volume breakdown where active conviction drives the move.
Comparing this to other assets on the same venue clarifies these limits. Both $ETH and $INJ also show an hourly direction down with volume not above its baseline. While all three share a downward path this hour, this is not a measured correlation or a sign of capital rotation. It simply reflects independent movements occurring simultaneously. The hourly direction can change rapidly, but the way a move holds reveals more about the underlying structure.
A scenario to watch is whether $PAXG can reclaim its previous level or if the current spot becomes a new ceiling. To reassess the interpretation, check if the RSI at 30.8427 begins to pivot while price stays flat. If the move holds below support without returning soon, the technical floor may require recalibration. 📉
Probabilistic market research, not a recommendation or guaranteed return.
The comparison to keep in mind: $ETH has hourly direction down and volume not above its baseline; $INJ has hourly direction down and volume not above its baseline. This alone does not establish correlation.
Which matters more in this comparison: direction or how the move holds?
#PAXG
The primary question for $PAXG involves how price interacts with its structural floor. Currently, the asset sits below support at 4051.95 and shows an hourly direction moving down. Trading activity remains quiet, as volume is not above baseline. One mechanism to consider is the liquidity gap; when a price slips below a known floor without a volume spike, it suggests a lack of aggressive sellers but also a temporary absence of buyers. This differs from a high-volume breakdown where active conviction drives the move.
Comparing this to other assets on the same venue clarifies these limits. Both $ETH and $INJ also show an hourly direction down with volume not above its baseline. While all three share a downward path this hour, this is not a measured correlation or a sign of capital rotation. It simply reflects independent movements occurring simultaneously. The hourly direction can change rapidly, but the way a move holds reveals more about the underlying structure.
A scenario to watch is whether $PAXG can reclaim its previous level or if the current spot becomes a new ceiling. To reassess the interpretation, check if the RSI at 30.8427 begins to pivot while price stays flat. If the move holds below support without returning soon, the technical floor may require recalibration. 📉
Probabilistic market research, not a recommendation or guaranteed return.
The comparison to keep in mind: $ETH has hourly direction down and volume not above its baseline; $INJ has hourly direction down and volume not above its baseline. This alone does not establish correlation.
Which matters more in this comparison: direction or how the move holds?
#PAXG