
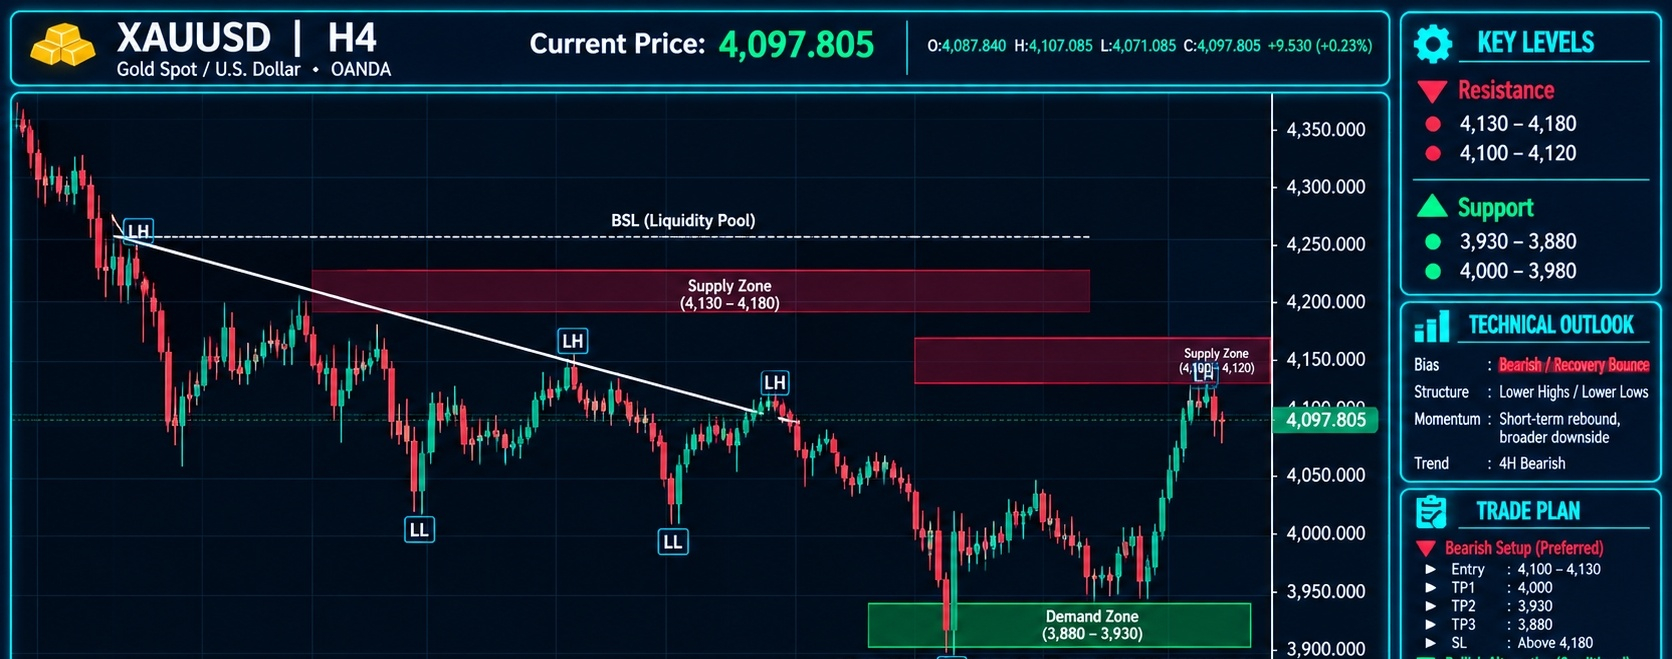

H4 Bias: Bearish / Recovery Bounce
Structure State: Established bearish structure with successive lower highs and lower lows beneath a descending trendline. Price has recovered sharply from the 3,880–3,930 demand region toward the 4,100–4,120 supply area, creating a short-term bullish reaction within the broader bearish structure.
Market Structure
$XAU maintains a broader bearish H4 structure following rejection from the 4,300–4,350 region. The market established a sequence of lower highs and lower lows, with the descending trendline confirming the sustained downside pressure.
The initial bearish displacement produced a significant decline through the 4,200 region, followed by successive lower highs around 4,150–4,180 and 4,100–4,120. The market subsequently continued lower, breaking intermediate support and extending toward the 3,880–3,930 demand region.
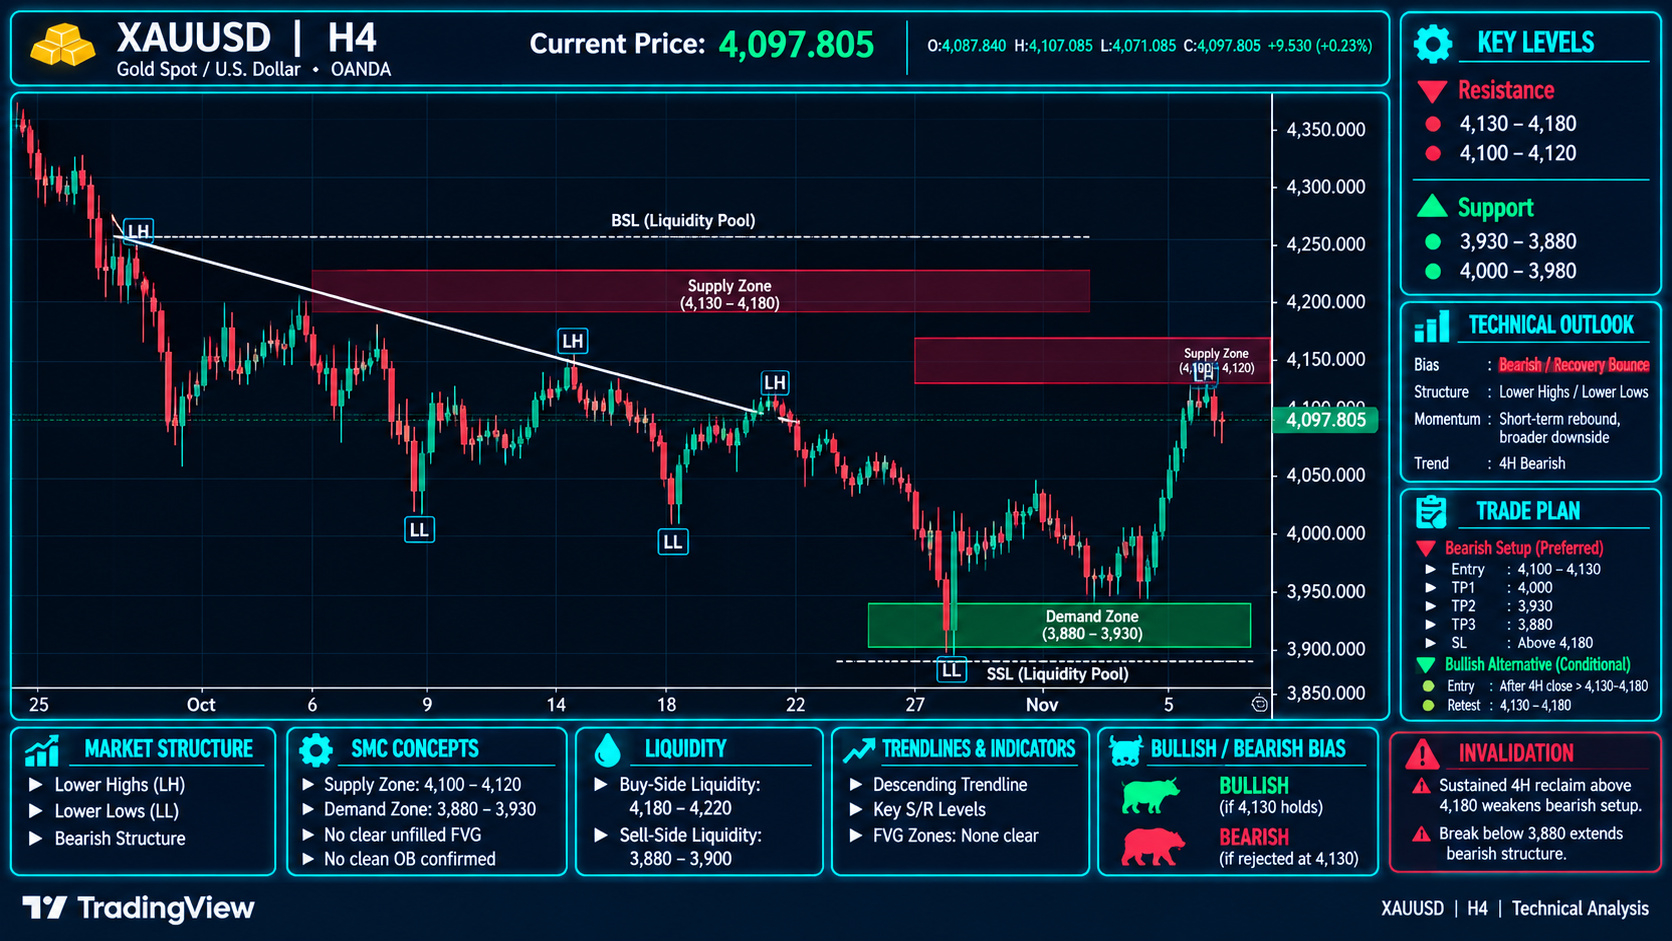
A significant reaction developed around the lower demand area, where sell-side liquidity accumulated beneath the recent lows. Buyers subsequently initiated a sharp recovery, pushing price back above 4,000 and toward the 4,100–4,120 supply region.
The latest candles indicate that price is testing this immediate supply area around 4,097.805. Although the recovery has improved short-term momentum, the broader bearish sequence remains intact. The current movement should therefore be treated as a recovery bounce unless price establishes a confirmed bullish change of character and reclaims the major resistance region.
Key Resistance
Resistance 1: 4,100–4,120 — immediate supply and current recovery resistance.
Resistance 2: 4,140–4,180 — major supply and previous lower-high region.
Key Support
Support 1: 4,000–3,980 — immediate support and potential bullish reaction area.
Support 2: 3,930–3,880 — major demand and previous sell-side liquidity sweep region.
FVG — Fair Value Gap
The chart does not identify a clearly confirmed unfilled FVG. The bearish displacement from the 4,140–4,180 region remains the primary downside imbalance reference. The current recovery toward 4,100–4,120 should be monitored for potential rejection rather than automatically classified as a confirmed bullish imbalance.
Order Block (OB)
The 4,100–4,120 region represents the immediate bearish supply and potential order-block area. Above it, 4,140–4,180 remains the major supply region associated with the established lower-high structure.
The 3,930–3,880 region represents the major demand zone, where the latest recovery originated. The 4,000–3,980 area is the nearer support reference during any corrective retracement.
Liquidity Map
Buy-side liquidity (BSL): Above 4,100–4,120, extending toward 4,140–4,180.
Sell-side liquidity (SSL): Around 3,880–3,930, where the recent downside liquidity sweep occurred.
Liquidity consideration: The recovery from major demand has brought price directly toward opposing supply. A sweep of nearby buy-side liquidity followed by bearish displacement could reinforce the broader downside structure.
Trade Scenarios
Bearish continuation: Rejection from 4,100–4,120 would maintain the broader bearish outlook. A renewed decline below 4,000–3,980 would expose the major 3,930–3,880 demand region. A confirmed breakdown beneath major demand would indicate renewed downside continuation.
Bullish alternative: Sustained H4 acceptance above 4,120 would weaken the immediate bearish continuation scenario and expose 4,140–4,180. A confirmed reclaim of this higher supply region would provide stronger evidence that the recovery is developing into a broader structural reversal.
Trendline
The descending trendline from the major highs remains the dominant bearish structural reference. The succession of lower highs and lower lows confirms that the earlier bullish structure has been invalidated. The latest recovery has improved short-term momentum, but a confirmed trendline break and subsequent higher-high formation would be required to challenge the prevailing bearish bias.
Invalidation
A sustained H4 close above 4,180 would invalidate the immediate bearish recovery-bounce scenario and provide stronger evidence of a bullish structural transition. A loss of 3,880 would invalidate the current major demand-based recovery thesis.
Professional Summary
Primary bias: Bearish / Recovery bounce.
Immediate supply: 4,100–4,120.
Major supply: 4,140–4,180.
Immediate support: 4,000–3,980.
Major demand: 3,930–3,880.
Recent SSL sweep: Around 3,880–3,930.
Bearish trigger: Rejection from 4,100–4,120 or confirmed breakdown below 3,980.
Bullish trigger: Sustained H4 reclaim above 4,120, followed by 4,180.
Structural invalidation: Acceptance above 4,180.
Risk consideration: Gold has produced a substantial recovery from the 3,880–3,930 demand region and is now approaching important supply. The immediate reaction around 4,100–4,120 is critical in determining whether the advance develops into a broader recovery or remains a corrective bounce within the established bearish H4 structure.