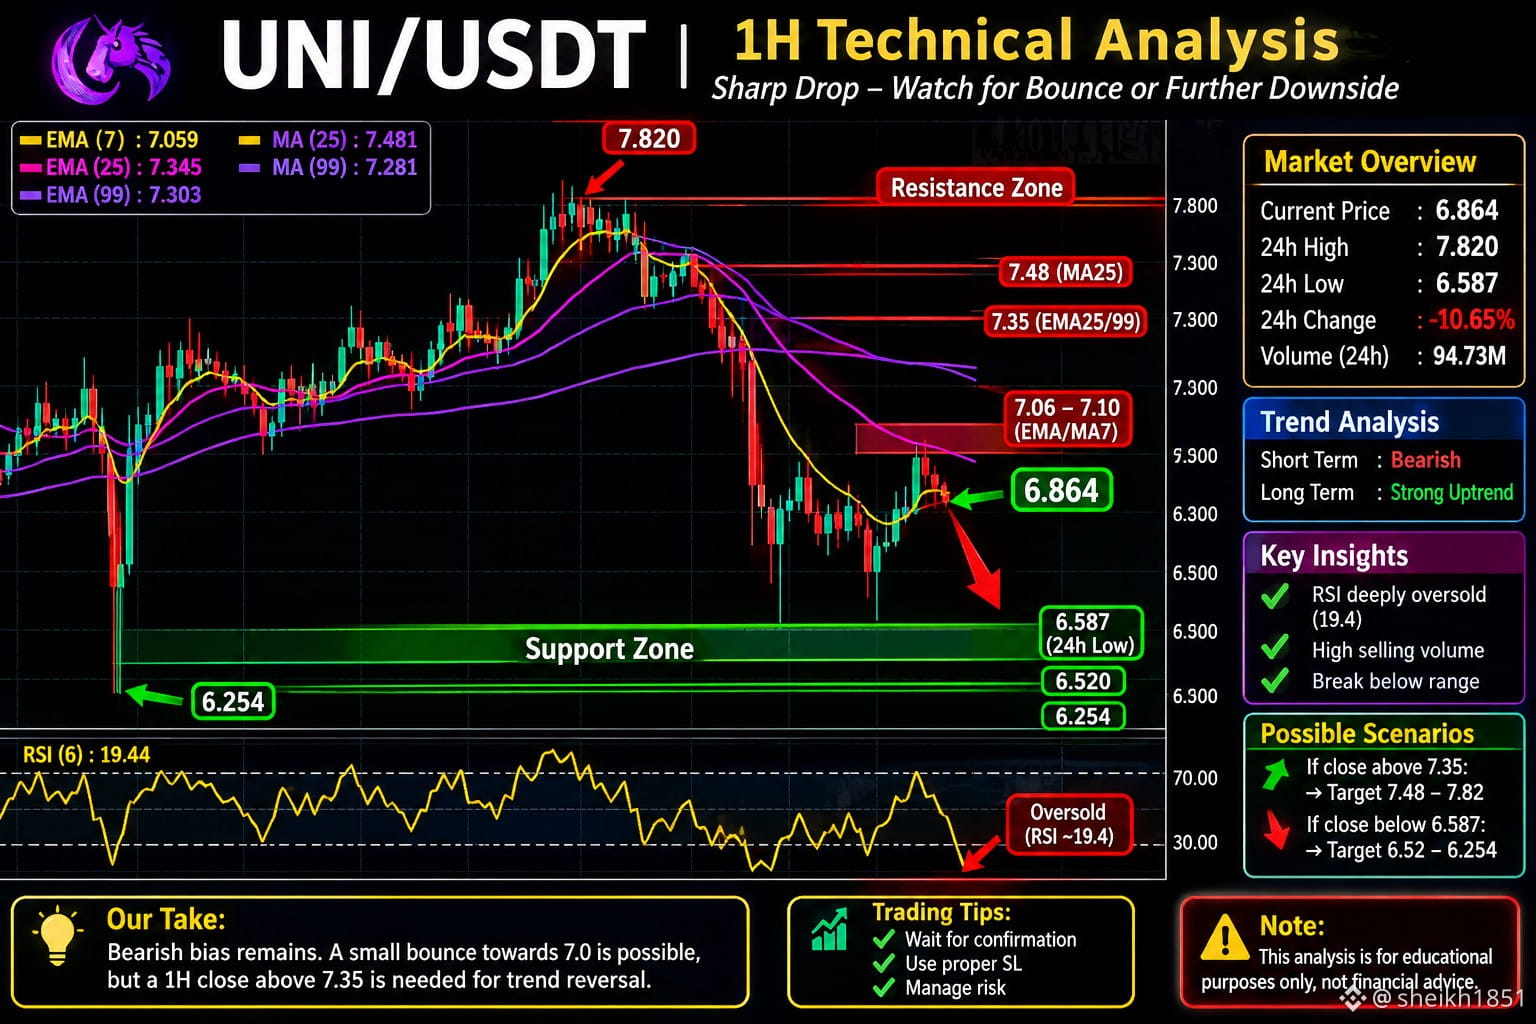
$UNI **UNI/USDT (1H) – Quick Analysis**
**Trend:** Sharply bearish in the short term. Price (6.864) is down about 10.7% on the day. It peaked near 7.82 (the 24h high), then dropped almost vertically through all the moving averages: EMA(7) 7.059, EMA(25) 7.345, EMA(99) 7.303, MA(25) 7.481 and MA(99) 7.281. The candle wicked down to 6.587 (the 24h low) and bounced to 6.864. This is a break below a range that had held since the 6.254 low. The longer picture is still strong: up about 72% over 90 days, 86% over 180 days and 37% over one year, though down about 25% over 30 days.
**Momentum:** RSI(6) is about 19.4, which is deeply oversold. That raises the odds of a relief bounce, but after a vertical drop RSI can stay low and price can keep sliding. Volume is high (about 94.7M USDT), which shows real selling pressure, not a thin dip.
**Key levels:**
- **Resistance:** 7.06 to 7.10 (EMA/MA 7), then 7.28 to 7.35 (the 99 and 25 EMAs), then 7.48 (MA 25) and the 7.82 high.
- **Support:** 6.587 (24h low), then 6.52, then 6.254 (the October low).
**Outlook:** The bias is bearish while price is below 7.06, and the 7.06 to 7.10 area is the first level any bounce would likely face. A relief bounce toward 7.0 would be normal after an oversold flush, but it would need a 1H close above 7.35 to start repairing the damage. A close below 6.587 would likely send price toward 6.52 and then retest 6.254. Given the heavy volume, wait for price to stabilize before treating any bounce as a reversal.
This is a technical read of one screenshot, not financial advice. Use stop-losses and keep position sizes small.
#BinanceReopensWithdrawalsForMoreAssets #USMidterms-WhatAreMarketsExpecting?
**Trend:** Sharply bearish in the short term. Price (6.864) is down about 10.7% on the day. It peaked near 7.82 (the 24h high), then dropped almost vertically through all the moving averages: EMA(7) 7.059, EMA(25) 7.345, EMA(99) 7.303, MA(25) 7.481 and MA(99) 7.281. The candle wicked down to 6.587 (the 24h low) and bounced to 6.864. This is a break below a range that had held since the 6.254 low. The longer picture is still strong: up about 72% over 90 days, 86% over 180 days and 37% over one year, though down about 25% over 30 days.
**Momentum:** RSI(6) is about 19.4, which is deeply oversold. That raises the odds of a relief bounce, but after a vertical drop RSI can stay low and price can keep sliding. Volume is high (about 94.7M USDT), which shows real selling pressure, not a thin dip.
**Key levels:**
- **Resistance:** 7.06 to 7.10 (EMA/MA 7), then 7.28 to 7.35 (the 99 and 25 EMAs), then 7.48 (MA 25) and the 7.82 high.
- **Support:** 6.587 (24h low), then 6.52, then 6.254 (the October low).
**Outlook:** The bias is bearish while price is below 7.06, and the 7.06 to 7.10 area is the first level any bounce would likely face. A relief bounce toward 7.0 would be normal after an oversold flush, but it would need a 1H close above 7.35 to start repairing the damage. A close below 6.587 would likely send price toward 6.52 and then retest 6.254. Given the heavy volume, wait for price to stabilize before treating any bounce as a reversal.
This is a technical read of one screenshot, not financial advice. Use stop-losses and keep position sizes small.
#BinanceReopensWithdrawalsForMoreAssets #USMidterms-WhatAreMarketsExpecting?