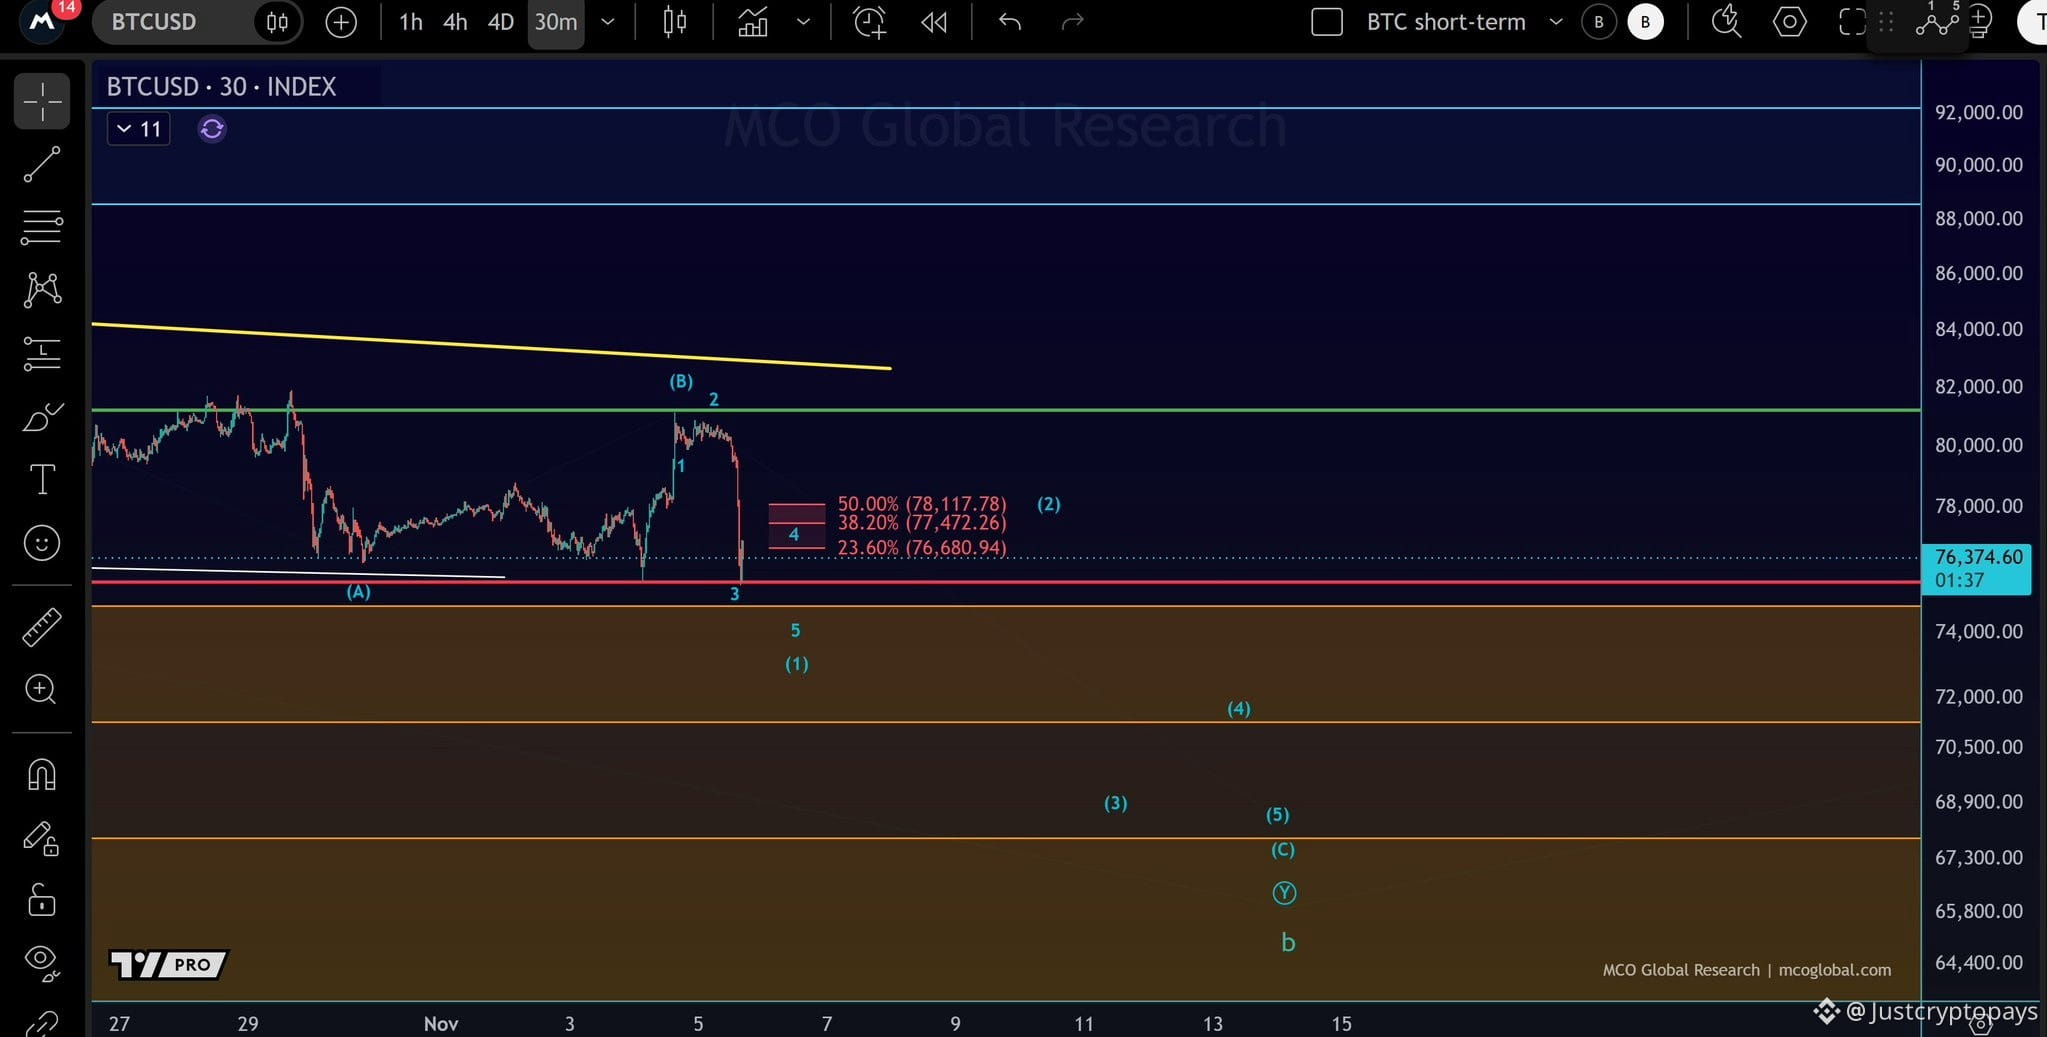
$BTC has dropped to the red line near the 50-week SMA, but the decline from the blue B-wave high is still unfolding in just three waves.
The pullback continues to look like a complex WXY correction. Resistance is now marked in red between $76,680.94 and $78,117.78. A wave 4 bounce into this zone, followed by one more move lower, would complete the five-wave decline in wave (1) of the C wave.
A break below $75,580 (the red line) would expose the next support zone between $63,326 and $74,800.
#Binance98PercentReplenished
The pullback continues to look like a complex WXY correction. Resistance is now marked in red between $76,680.94 and $78,117.78. A wave 4 bounce into this zone, followed by one more move lower, would complete the five-wave decline in wave (1) of the C wave.
A break below $75,580 (the red line) would expose the next support zone between $63,326 and $74,800.
#Binance98PercentReplenished