

H4 Bias: Bearish
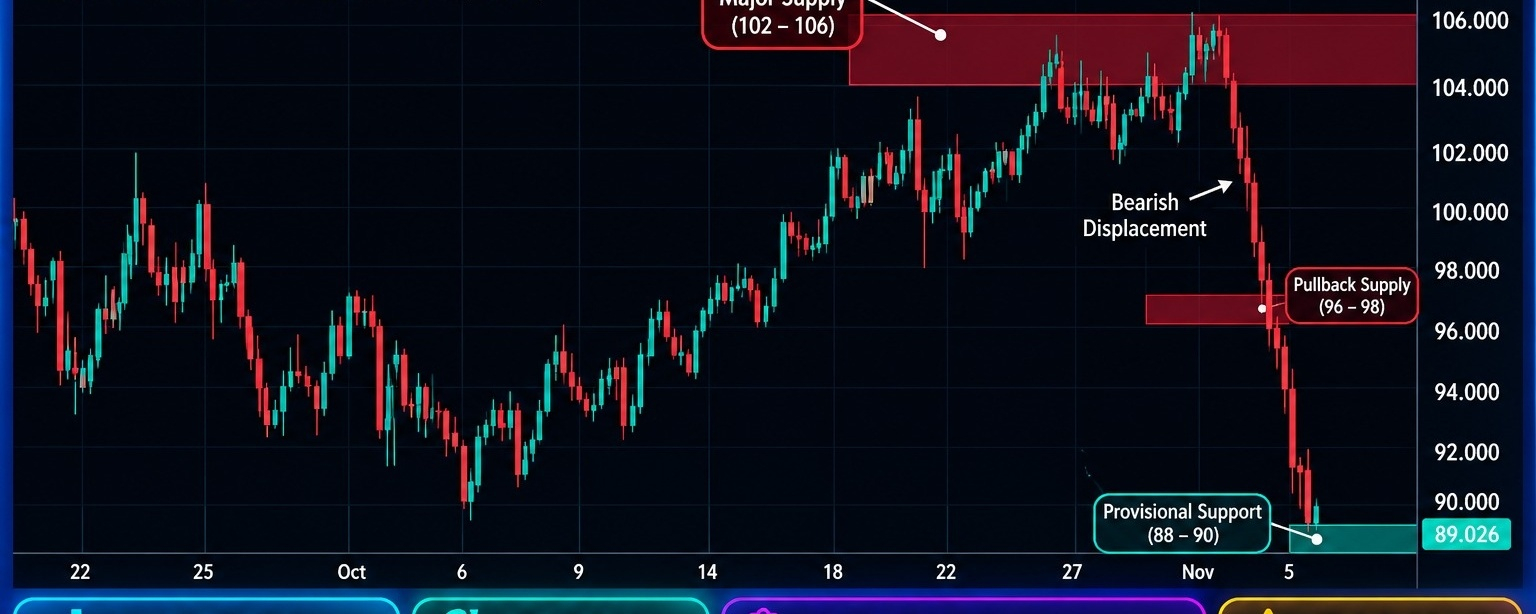
Structure State: Strong bullish advance from the October lows toward the 102–106 major supply region, followed by rejection, bearish displacement, and a sharp structural breakdown toward the 88–90 provisional support area.
Market Structure
$CL Crude Oil experienced a substantial bullish advance during October, establishing a sequence of higher highs and higher lows before reaching the 102–106 major supply region.
Price subsequently encountered strong selling pressure near the highs, where the bullish structure began losing momentum. The rejection produced bearish displacement, followed by a significant downward expansion that invalidated the preceding bullish sequence.
The sharp decline has carried price toward the 88–90 provisional support region. The current area represents an important potential reaction zone, but the magnitude of the bearish displacement indicates that sellers remain in control.
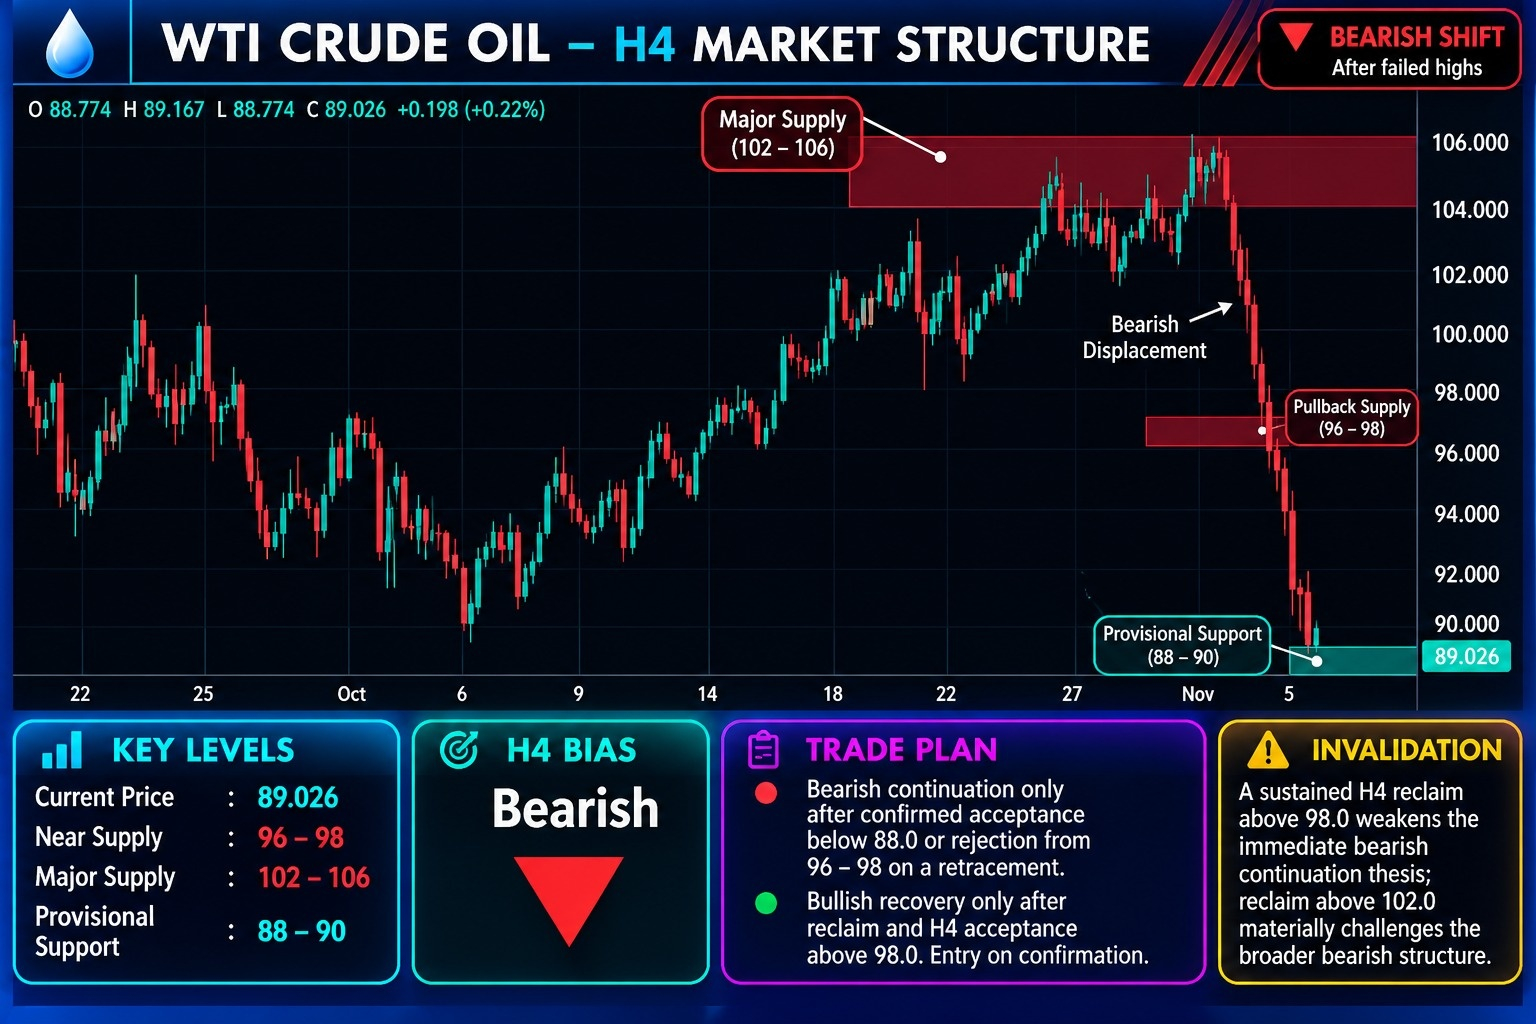
The broader H4 structure has shifted bearish following the rejection from major supply. Any recovery should initially be treated as corrective unless price establishes a confirmed bullish change of character.
Key Resistance
Resistance 1: 95.0–98.0 — immediate pullback supply and potential bearish continuation area.
Resistance 2: 102.0–106.0 — major supply and previous distribution region.
Key Support
Support 1: 88.0–90.0 — provisional support and immediate reaction area.
Lower Target: Further downside remains conditional on a confirmed breakdown below the provisional support region.
FVG — Fair Value Gap
The sharp bearish displacement following rejection from the 102–106 supply region may have created bearish imbalances during the decline. The 95–98 pullback region is particularly relevant for monitoring potential bearish continuation, although a specific FVG must be confirmed through the actual three-candle structure.
Order Block (OB)
The 102–106 region represents the primary major bearish supply and potential distribution area. The 95–98 region is the immediate pullback supply area, where sellers may attempt to re-establish control following a corrective recovery.
The 88–90 region represents provisional support rather than confirmed bullish demand. Sustained buying displacement would be necessary to establish a stronger recovery structure.
Liquidity Map
Buy-side liquidity (BSL): Above 95–98, extending toward the 102–106 major supply region.
Sell-side liquidity (SSL): Below 88–90, subject to confirmation of a structural breakdown.
Trade Scenarios
Bearish continuation: A confirmed H4 acceptance below 88.0 would strengthen the downside continuation scenario and indicate that the provisional support region has failed.
Bearish pullback: A corrective recovery toward 95–98 followed by bearish rejection and displacement would support continuation of the newly established bearish structure.
Bullish recovery: Sustained reclaim and H4 acceptance above 98.0 would weaken the immediate bearish continuation scenario. A stronger structural recovery would require further acceptance above 102.0.
Trendline
The preceding October bullish structure has been invalidated by the recent bearish displacement. The sharp decline represents a significant change in directional momentum. Any developing recovery should be evaluated against the 95–98 resistance region before considering a broader bullish transition.
Invalidation
A sustained H4 reclaim above 98.0 would weaken the immediate bearish continuation thesis. Acceptance above 102.0 would materially challenge the broader bearish structure and suggest a more significant recovery.
Professional Summary
Primary bias: Bearish.
Immediate resistance: 95.0–98.0.
Major supply: 102.0–106.0.
Provisional support: 88.0–90.0.
Bearish trigger: Confirmed H4 acceptance below 88.0.
Pullback opportunity: Bearish confirmation within 95.0–98.0.
Recovery trigger: Sustained H4 reclaim above 98.0.
Broader invalidation: Acceptance above 102.0.
Risk consideration: WTI has experienced an aggressive bearish displacement and is approaching provisional support. A corrective recovery is possible, but the prevailing structure remains bearish until price demonstrates sustained acceptance above the marked resistance levels.