

H4 Bias: Bullish Recovery
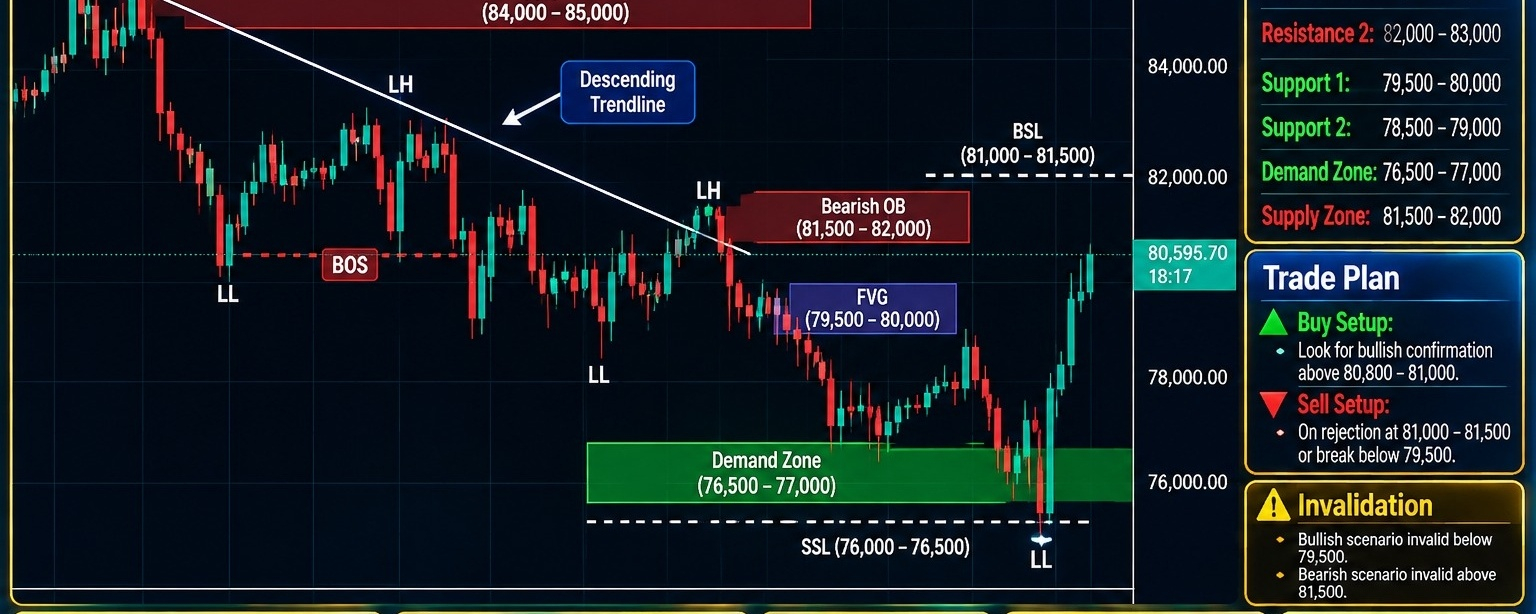
Structure State: Extended bearish decline from the 84,000–85,000 supply region, descending trendline formation, sell-side liquidity sweep near 76,000–76,500, and strong bullish recovery toward 80,500.
Market Structure
$BTC experienced a sustained bearish decline from the 84,000–85,000 supply region, developing a sequence of lower highs and lower lows beneath a descending trendline.
The decline accelerated toward the 76,000–76,500 sell-side liquidity region, where price produced a significant reaction. Following the liquidity sweep, buyers generated strong bullish displacement and recovered toward the 80,000–81,000 area.
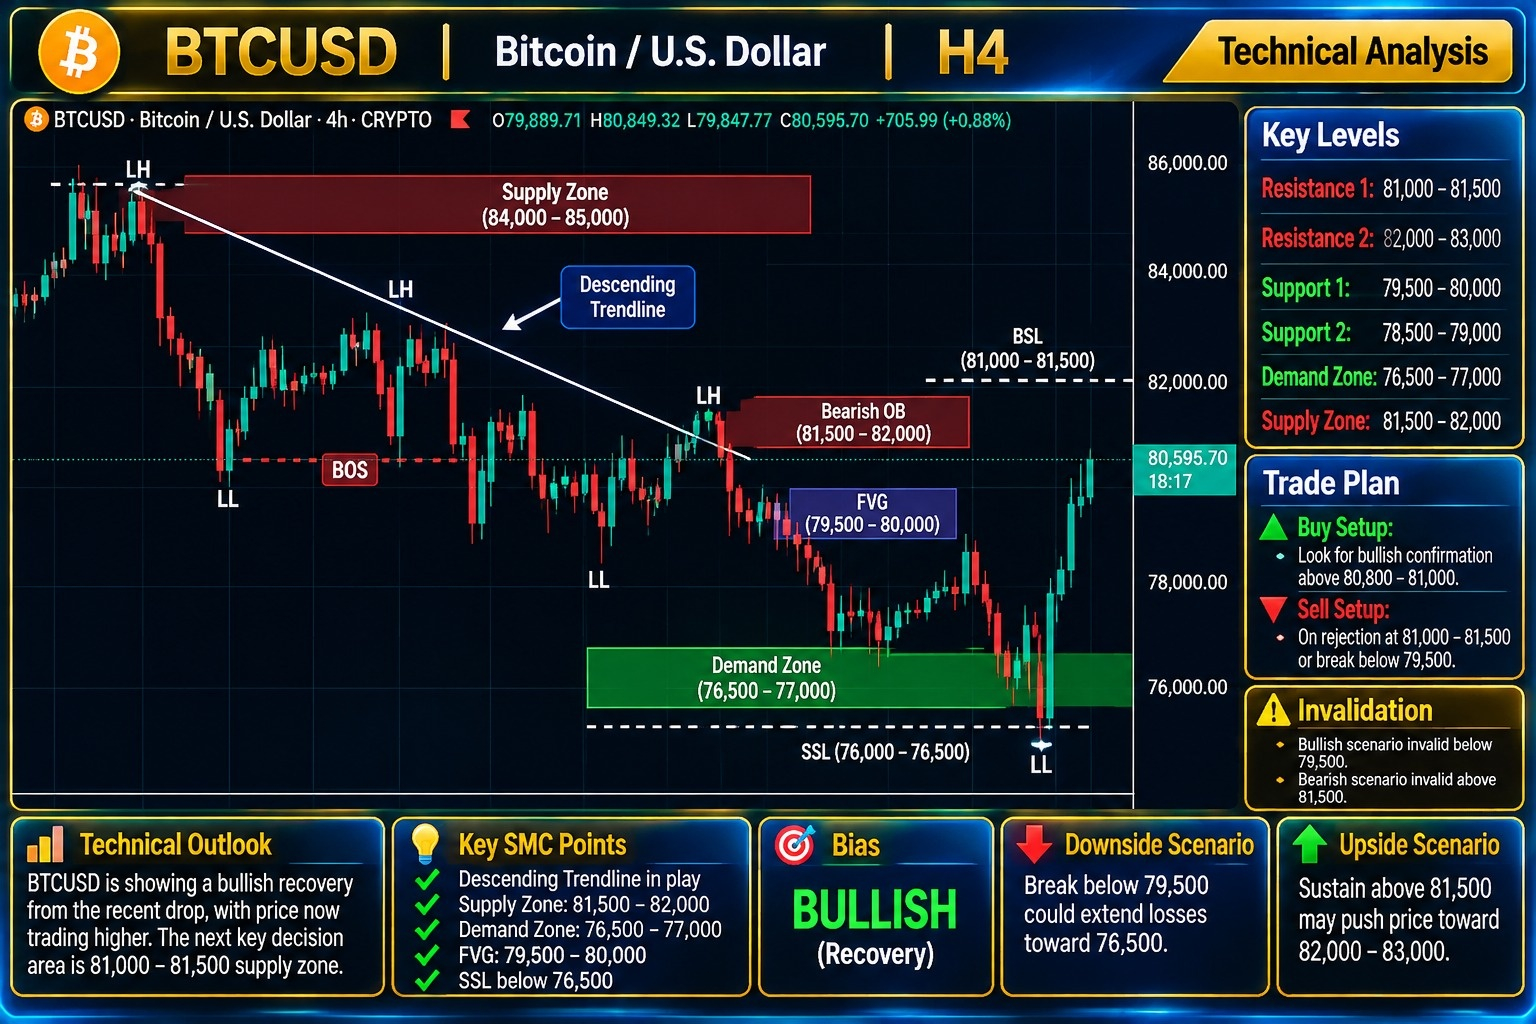
The latest recovery indicates improving short-term momentum, but the broader bearish structure has not yet been fully invalidated. Price is approaching the 81,000–81,500 resistance region, which represents an important structural decision area.
A sustained reclaim of this region would strengthen the bullish recovery and potentially expose the higher 82,000–83,000 area.
Key Resistance
Resistance 1: 81,000–81,500 — immediate resistance and descending trendline decision area.
Resistance 2: 81,500–82,000 — bearish order-block and supply region.
Higher Resistance: 82,000–83,000 — potential bullish continuation objective.
Major Supply: 84,000–85,000 — previous distribution and major resistance.
Key Support
Support 1: 79,500–80,000 — immediate support and potential bullish imbalance.
Support 2: 78,500–79,000 — secondary structural support.
Major Demand: 76,500–77,000 — recovery origin and demand region.
Sell-Side Liquidity: 76,000–76,500.
FVG — Fair Value Gap
The bullish displacement following the recent sell-side liquidity sweep may have established bullish imbalances around the 79,500–80,000 region. This area represents an important potential retracement zone. Its validity should be assessed against the actual three-candle formation.
Order Block (OB)
The 81,500–82,000 region represents the primary candidate bearish order-block and supply area. The 76,500–77,000 region remains the major demand area associated with the recent recovery.
Liquidity Map
Buy-side liquidity (BSL): Above 81,000–81,500, extending toward 82,000–83,000.
Sell-side liquidity (SSL): Below 79,500, with major liquidity around 76,000–76,500.
Trade Scenarios
Bullish recovery: Sustained acceptance above 80,800–81,000 would improve the immediate bullish outlook. A confirmed break above 81,500 could support further expansion toward 82,000–83,000.
Bullish pullback: A retracement toward 79,500–80,000 followed by bullish displacement would support continuation of the recovery structure.
Bearish continuation: Rejection from 81,000–81,500 followed by a decisive breakdown below 79,500 would weaken the recovery and expose 78,500–79,000, followed by the lower demand region.
Trendline
The descending trendline remains relevant to the broader bearish structure. The current bullish recovery is challenging this downward trajectory. A sustained break above the trendline and 81,500 resistance would provide stronger evidence of a structural reversal.
Invalidation
A sustained H4 close below 76,500 would invalidate the immediate bullish recovery structure. Acceptance above 81,500 would materially weaken the prevailing bearish outlook.
Professional Summary
Primary bias: Bullish recovery within a broader bearish structure.
Immediate resistance: 81,000–81,500.
Major supply: 81,500–82,000.
Higher resistance: 82,000–83,000.
Immediate support: 79,500–80,000.
Major demand: 76,500–77,000.
Bullish trigger: Sustained acceptance above 81,500.
Bearish trigger: Confirmed breakdown below 79,500.
Risk consideration: BTCUSD has produced a strong recovery from the recent liquidity sweep, but price is approaching significant overhead supply. Confirmation above 81,500 is necessary before treating the move as a broader bullish reversal.