#sol 📊 Solana (SOL) Technical & Market Overview ($95.97 Zone)
#Solana #SOL #CryptoAnalysis #BinanceSquare
1. Market Snapshot & Price Action
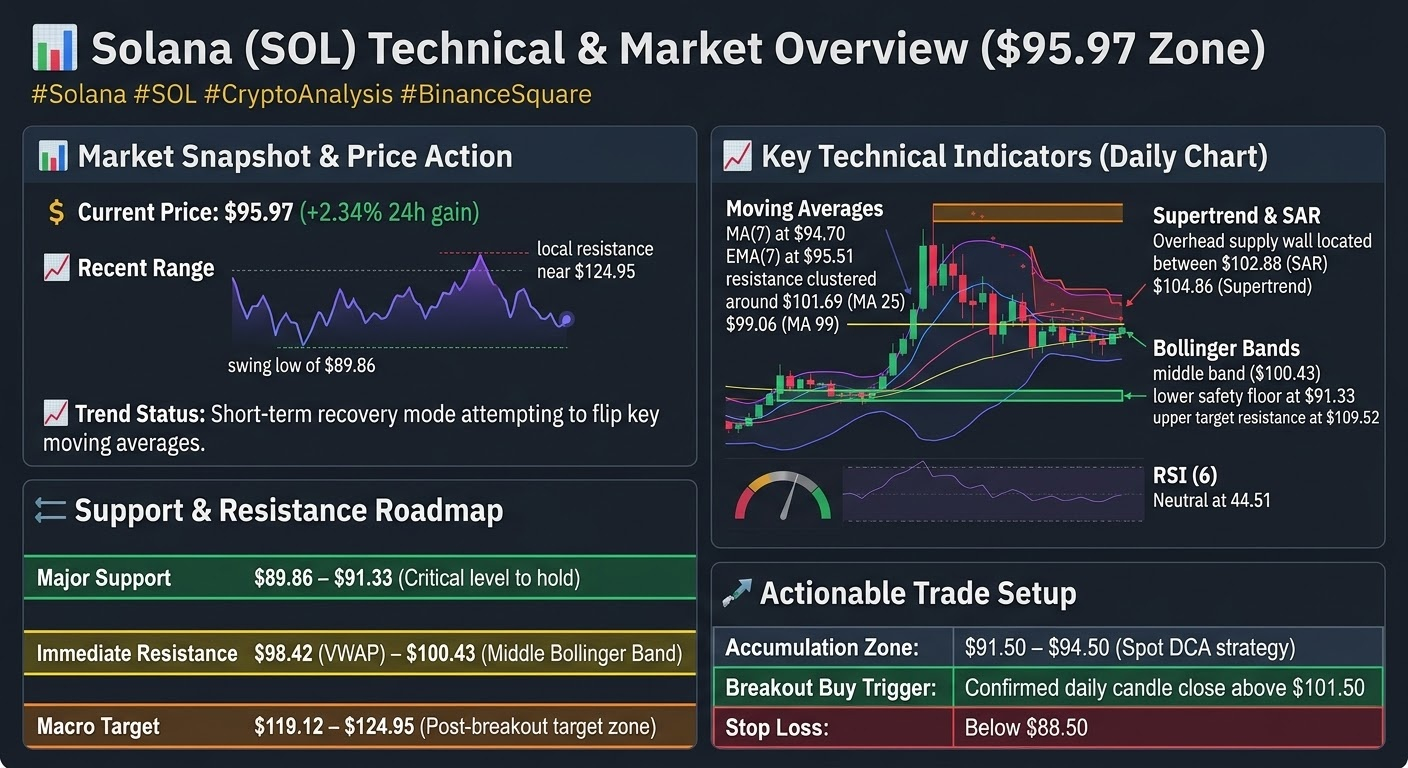
Current Price: $95.97 (+2.34% 24h gain)
Recent Range: Rebounded from a swing low of $89.86 after pulling back from local resistance near $124.95.
Trend Status: Short-term recovery mode attempting to flip key moving averages.
2. Key Technical Indicators (Daily Chart)
Moving Averages: Short-term MA(7) sits at $94.70 and EMA(7) at $95.51, showing immediate support. However, medium-term resistance is heavily clustered around $101.69 (MA 25) and $99.06 (MA 99).
Bollinger Bands: Trading near the middle band ($100.43) with a lower safety floor at $91.33 and upper target resistance at $109.52.
Supertrend & SAR: Overhead supply wall located between $102.88 (SAR) and $104.86 (Supertrend).
RSI (6): Neutral at 44.51, indicating balanced momentum with room for a directional breakout.
3. Support & Resistance Roadmap
Major Support: $89.86 – $91.33 (Critical level to hold for bulls).
Immediate Resistance: $98.42 (VWAP) – $100.43 (Middle Bollinger Band).
Macro Target: $119.12 – $124.95 (Post-breakout target zone).
4. Actionable Trade Setup
Accumulation Zone: $91.50 – $94.50 (Spot DCA strategy)
Breakout Buy Trigger: Confirmed daily candle close above $101.50
Stop Loss: Below $88.50