



SOL remains below $99; buyers need a reclaim before $103–104 resistance returns to focus and recovery gains credibility again soon.
Lower highs have been seen on the 4-hour chart with rebounds failing around the $93.20 low, and sellers are in control.
Liquidation estimates cluster around $100–105, but those pockets cannot guarantee a rally or squeeze without sustained buying momentum.
Solana Price Outlook Faces Another Test Below $99
Solana price outlook remains cautious as sellers maintain pressure, while buyers face several resistance levels before any lasting recovery becomes possible. The market continues struggling to regain ground lost during October's decline.
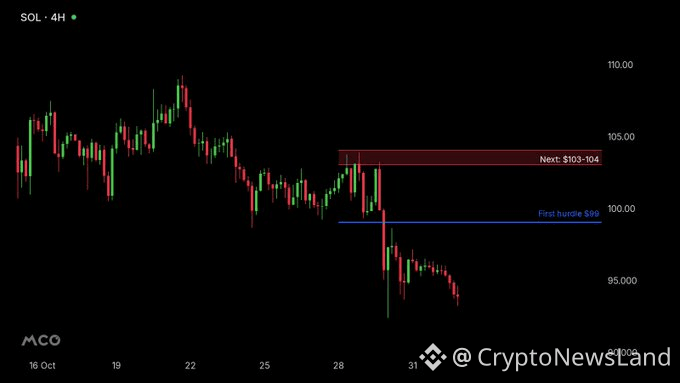
More Crypto Online places $99 as SOL's first hurdle toward $103–104. Its commentary states that reclaiming $99 would improve the recovery case, though resistance above remains unresolved. The distinction keeps both price levels relevant.
 Source: X
SOL as of writing trades at $93.76, up 1.55% on the 24-hour chart. Prices had declined from $107-108 to $100 in the previous 4-hour time frame. Several recovery attempts failed, leaving lower highs across the subsequent candles.
The late-October rebound reached $103–104 before sellers pushed prices lower. That rejection preceded the break beneath $99, shifting the level into resistance. Buyers now need to reclaim it before another move gains traction.
SOL Price Action Shows Sellers Retaining Control
The chart as of writing showed SOL trading at around $95.20 before weakening. Price has then tested a strong bottom work at $93.20. The upswing was appreciated, but it was short-lived.
SOL recovered toward $94.50–95.00 before another push higher briefly reached $95.50. Sellers quickly erased much of that advance, returning the price toward $93.80. The failed bounce left the intraday structure leaning lower.
The $93.20 area now serves as a nearby reference for traders. A break beneath that low could extend the current decline. Holding above it may allow another bounce, although reversal confirmation remains absent.
The total volume reported for 24 hours was around $2 billion, an increase of 73.65%. Activity picked up in the downtrend, while prices were unable to hold gains. The figures show heavier participation alongside continued selling pressure.
SOL Liquidation Map Points Toward Higher Price Clusters
The 30-day liquidation map shows estimated short exposure around $100–105. Data from Binance, OKX, and Bybit contributes to the displayed exchange clusters. These estimates describe leveraged positions that could face forced closure.
At the selected $103.9 level, cumulative short liquidation leverage appeared near $415.39 million. Binance showed approximately $7.10 million, while OKX recorded around $4.46 million. Bybit's displayed figure stood near $821,350.
If it moves above $99, then the $100-104 area will be back in sight. When buying pressure intensifies, short liquidations can push the price up even more. However, the map cannot establish whether SOL will reach those levels.
The lower liquidation clusters also matter if selling continues. A decline beneath $93.20 could expose SOL to further weakness. The previously discussed $90 area remains a reference, rather than confirmed support.
For now, SOL remains below its first recovery hurdle. Buyers must reclaim $99 before challenging the $103–104 resistance zone. Until price makes that move, sellers retain the stronger position.