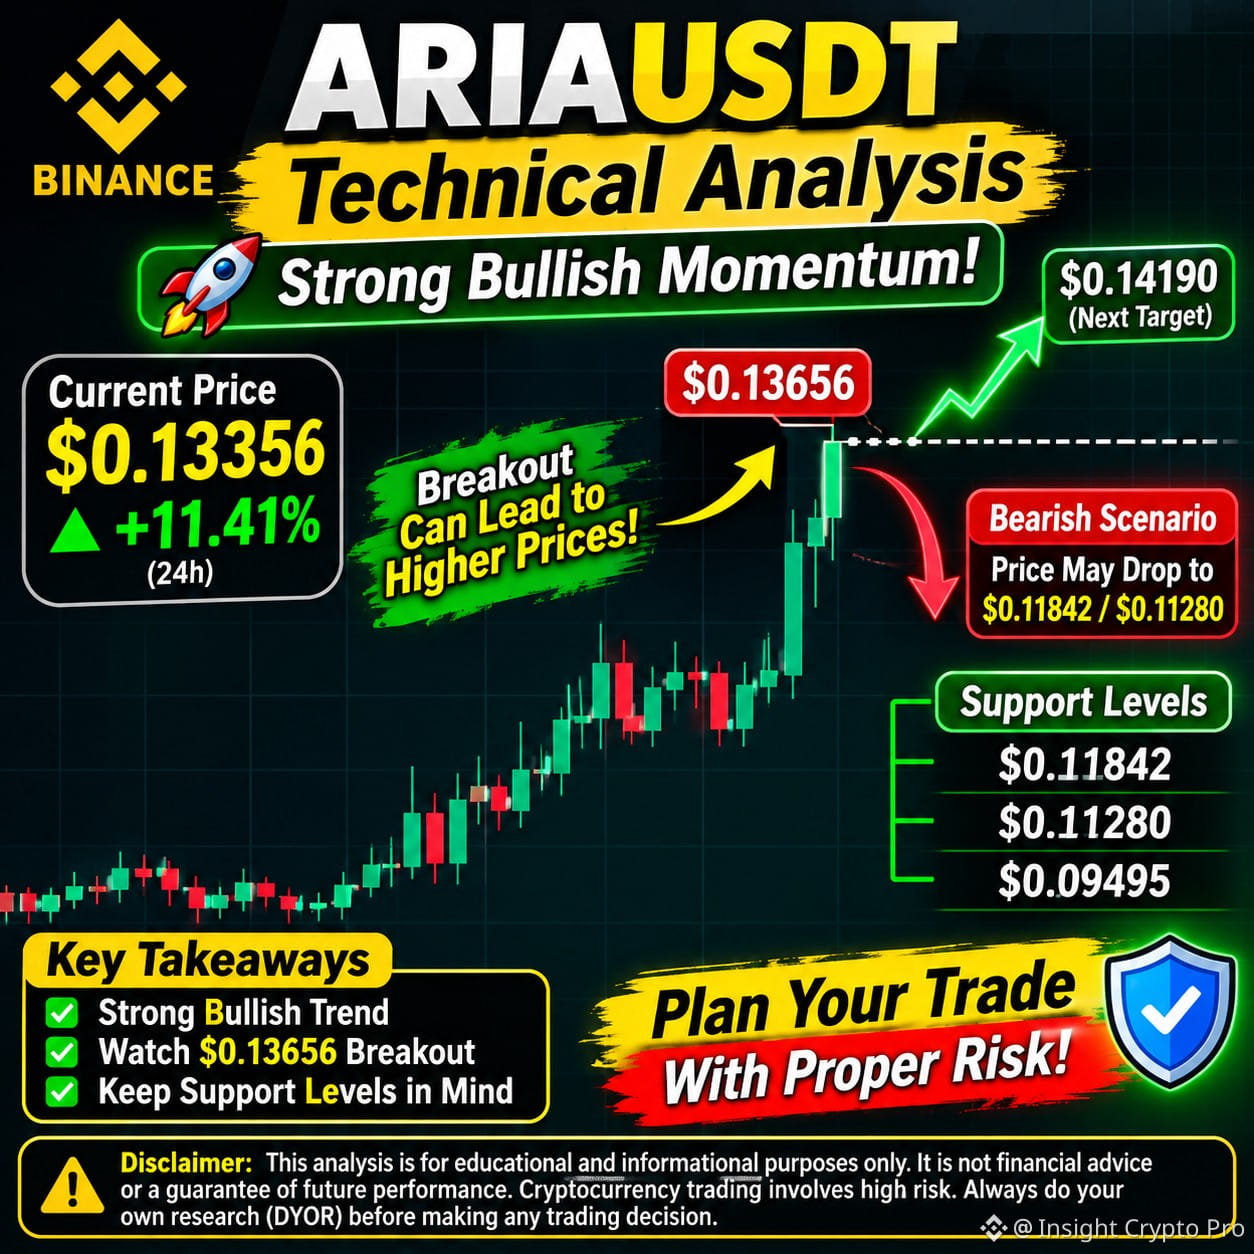
📊 ARIAUSDT PRICE ANALYSIS | BULLISH MOMENTUM 🚀
$ARIA USDT is showing strong bullish momentum on the 1D timeframe, trading around $0.13356, up 11.41% in the last 24 hours.
📈 KEY MARKET DATA
🔹 Current Price: $0.13356
🔹 24H High: $0.13656
🔹 24H Low: $0.11280
🔹 24H Volume: $39.68M USDT
🔍 TECHNICAL ANALYSIS
$ARIA has experienced a significant upward move from approximately $0.02986, indicating strong buying momentum. However, the price is now approaching a critical resistance zone.
🟢 Resistance Levels
• $0.13656 — Immediate resistance
• $0.14190 — Potential next resistance
🟢 Support Levels
• $0.11842 — First support zone
• $0.11280 — Important support
• $0.09495 — Deeper support if selling pressure increases
📈 BULLISH SCENARIO
A strong daily candle close above $0.13656, followed by a successful retest, could open the door toward $0.14190 and potentially higher levels.
📉 BEARISH SCENARIO
If ARIA fails to break resistance, profit-taking could push the price toward $0.11842 or even $0.11280.
⚠️ TRADING STRATEGY
Avoid FOMO buying after a sharp rally. Watch for a confirmed breakout or a healthy pullback before considering an entry. Always manage risk carefully.
⚠️ DISCLAIMER
This post is for educational and informational purposes only, based on the chart provided. It is not financial advice or a guarantee of future performance. Cryptocurrency trading involves substantial risk, and you could lose your entire investment. Always conduct your own research (DYOR) before making any trading decisions.
#ARIA #ARIAUSDT #CryptoAnalysis #Binance #CryptoTrading #TechnicalAnalysis
$ARIA USDT is showing strong bullish momentum on the 1D timeframe, trading around $0.13356, up 11.41% in the last 24 hours.
📈 KEY MARKET DATA
🔹 Current Price: $0.13356
🔹 24H High: $0.13656
🔹 24H Low: $0.11280
🔹 24H Volume: $39.68M USDT
🔍 TECHNICAL ANALYSIS
$ARIA has experienced a significant upward move from approximately $0.02986, indicating strong buying momentum. However, the price is now approaching a critical resistance zone.
🟢 Resistance Levels
• $0.13656 — Immediate resistance
• $0.14190 — Potential next resistance
🟢 Support Levels
• $0.11842 — First support zone
• $0.11280 — Important support
• $0.09495 — Deeper support if selling pressure increases
📈 BULLISH SCENARIO
A strong daily candle close above $0.13656, followed by a successful retest, could open the door toward $0.14190 and potentially higher levels.
📉 BEARISH SCENARIO
If ARIA fails to break resistance, profit-taking could push the price toward $0.11842 or even $0.11280.
⚠️ TRADING STRATEGY
Avoid FOMO buying after a sharp rally. Watch for a confirmed breakout or a healthy pullback before considering an entry. Always manage risk carefully.
⚠️ DISCLAIMER
This post is for educational and informational purposes only, based on the chart provided. It is not financial advice or a guarantee of future performance. Cryptocurrency trading involves substantial risk, and you could lose your entire investment. Always conduct your own research (DYOR) before making any trading decisions.
#ARIA #ARIAUSDT #CryptoAnalysis #Binance #CryptoTrading #TechnicalAnalysis