
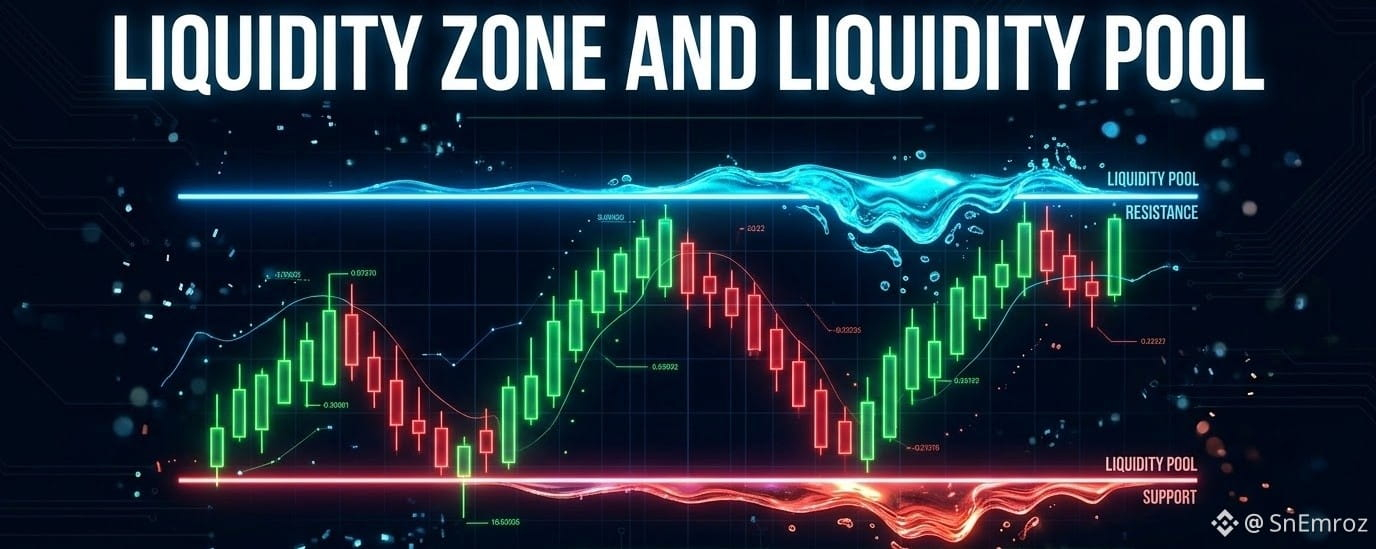

Prie does not move randomly. It moves toward places where many orders are waiting. Those places are called liquidity. When you learn to see them you stop getting trapped by fake breakouts and you start to understand why price suddenly spikes and comes back.
What is liquidity?
Liquidity means orders waiting in the market. Every stop loss, every pending buy or sell order and every breakout order is liquidity. Big traders need a lot of orders on the other side to fill their large positions. So price often travels to the place where those orders are sitting.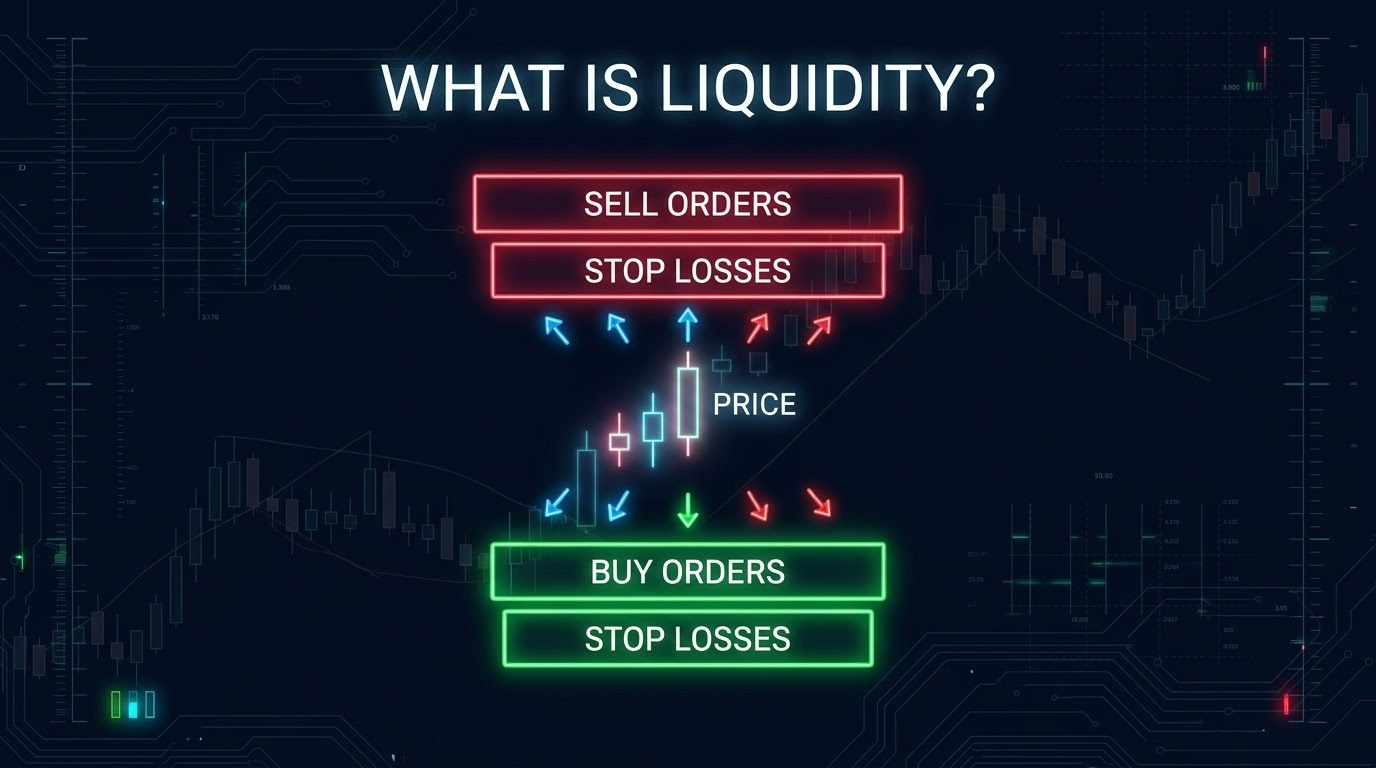
What is a liquidity zone?
A liquidity zone is an area on the chart where many orders sit. It is usually near an obvious level that most traders can see.
Previous highs and lows
Support and resistance
Round numbers like 100 or 0.5000
Trendlines
Range high and range low
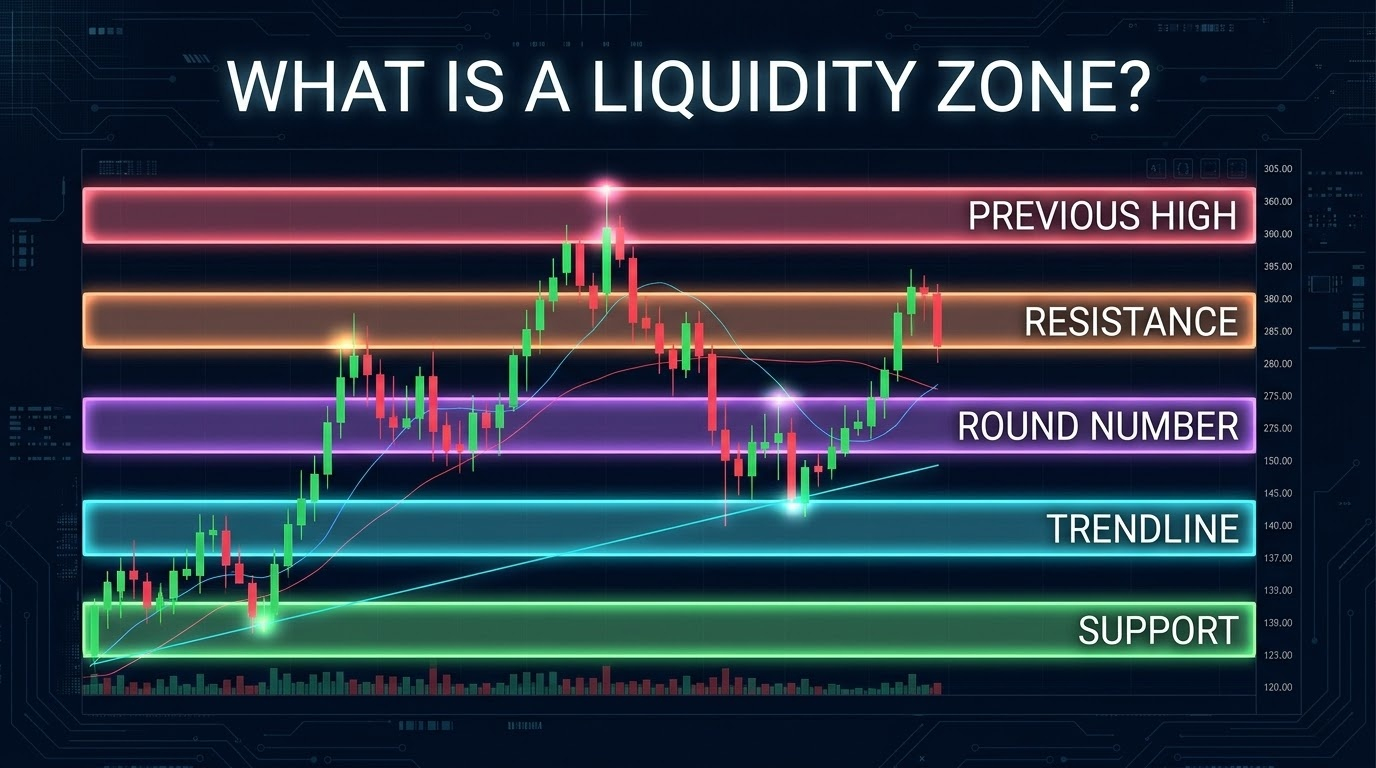
Many traders place their stop loss just above resistance or just below support. So those areas become packed with orders.
What is a liquidity pool?
A liquidity pool is a thick cluster of orders sitting in one tight spot. Think of it as a pool of stop losses waiting to be touched. There are two types.
Buy side liquidity sits above highs. It holds the stop losses of short traders and the buy orders of breakout traders.
Sell side liquidity sits below lows. It holds the stop losses of long traders and the sell orders of breakdown traders.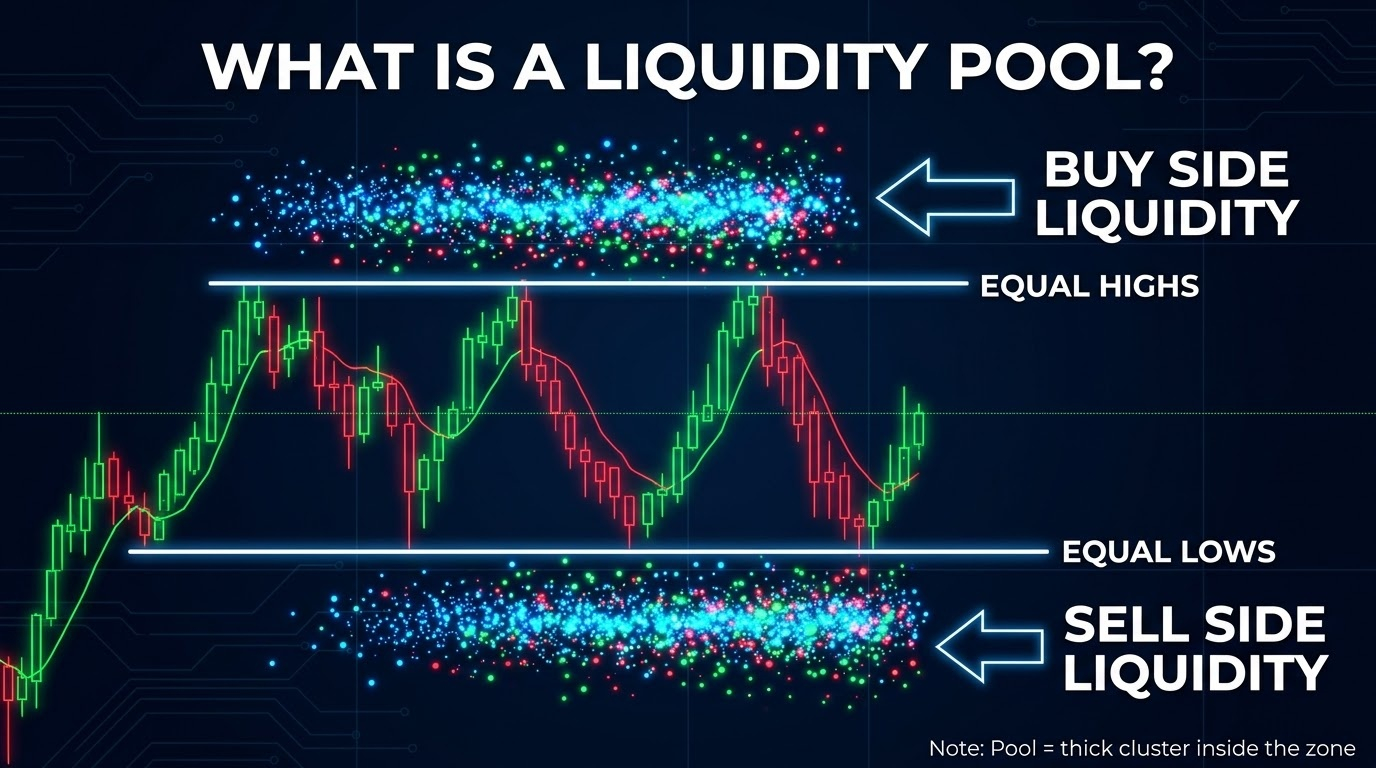
Equal highs and equal lows are the strongest pools because everybody sees them and everybody puts the stop in the same place.
Simple difference. A zone is the wide area. A pool is the thick cluster of orders inside that area.
Why price goes to liquidity?
A large player cannot buy a big size at any price without pushing the market up.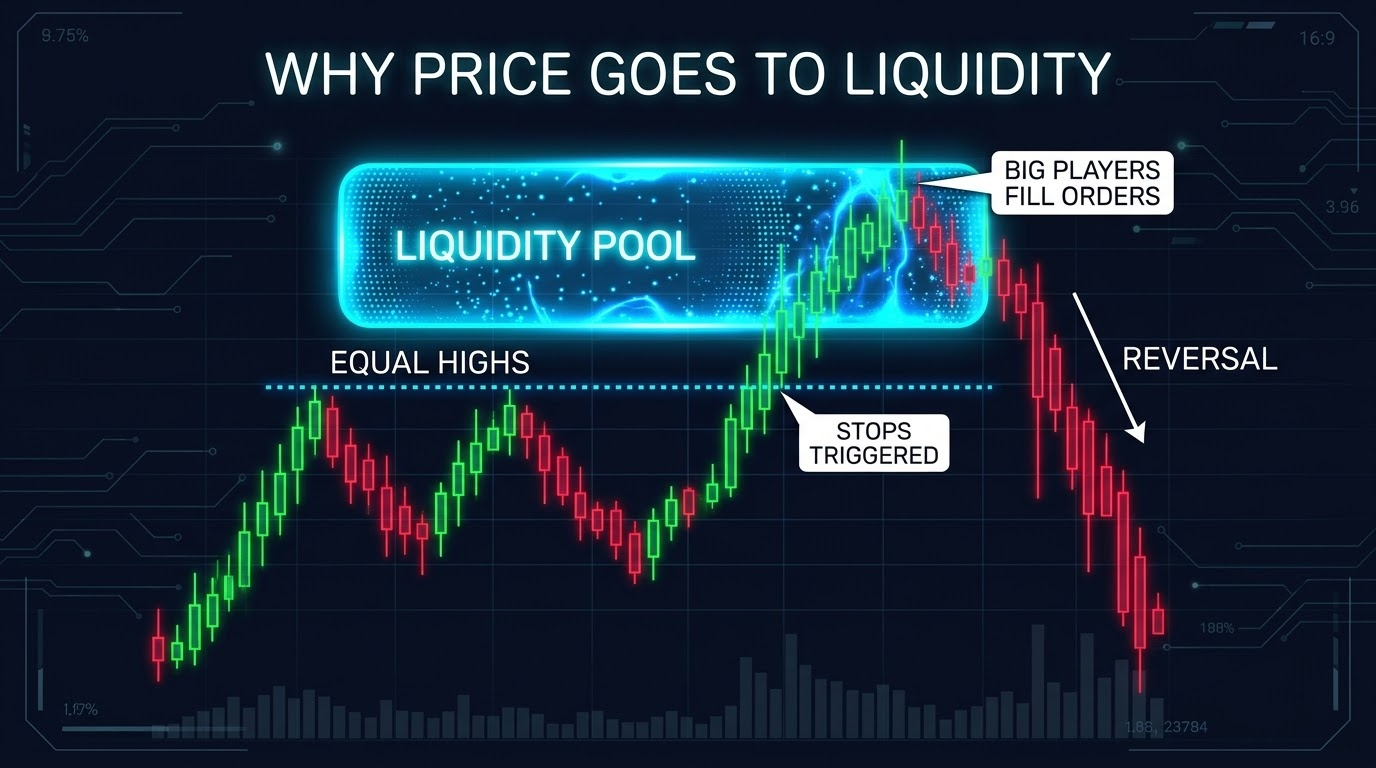
They need sellers to take the other side. When a stop loss is hit it becomes a market order. So when price runs into a pool the stops trigger and give large players the orders they need. After that price often reverses. It does not happen every time but it happens often enough to matter.
What is a liquidity sweep?
A liquidity sweep is when price spikes through a level, grabs the stops and then closes back inside. On the chart you see a long wick.
Bullish sweep. Price drops below support, leaves a long lower wick and closes back above it.
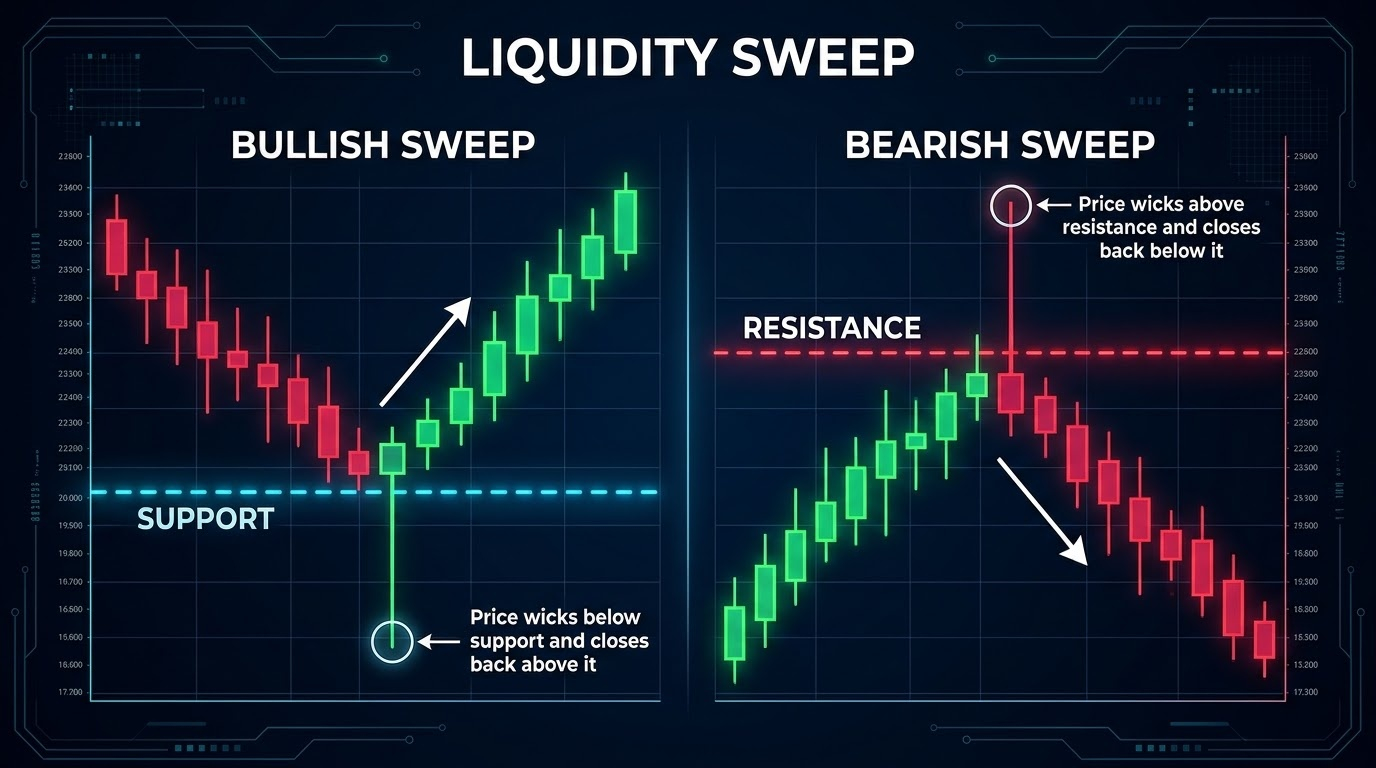
Bearish sweep. Price pushes above resistance, leaves a long upper wick and closes back below it.
Sweep or real breakout?
This is the hardest part. Here is a simple way to tell them apart.
Sweep. A wick goes through the level but the candle closes back inside. Price returns fast and the move has no follow through.
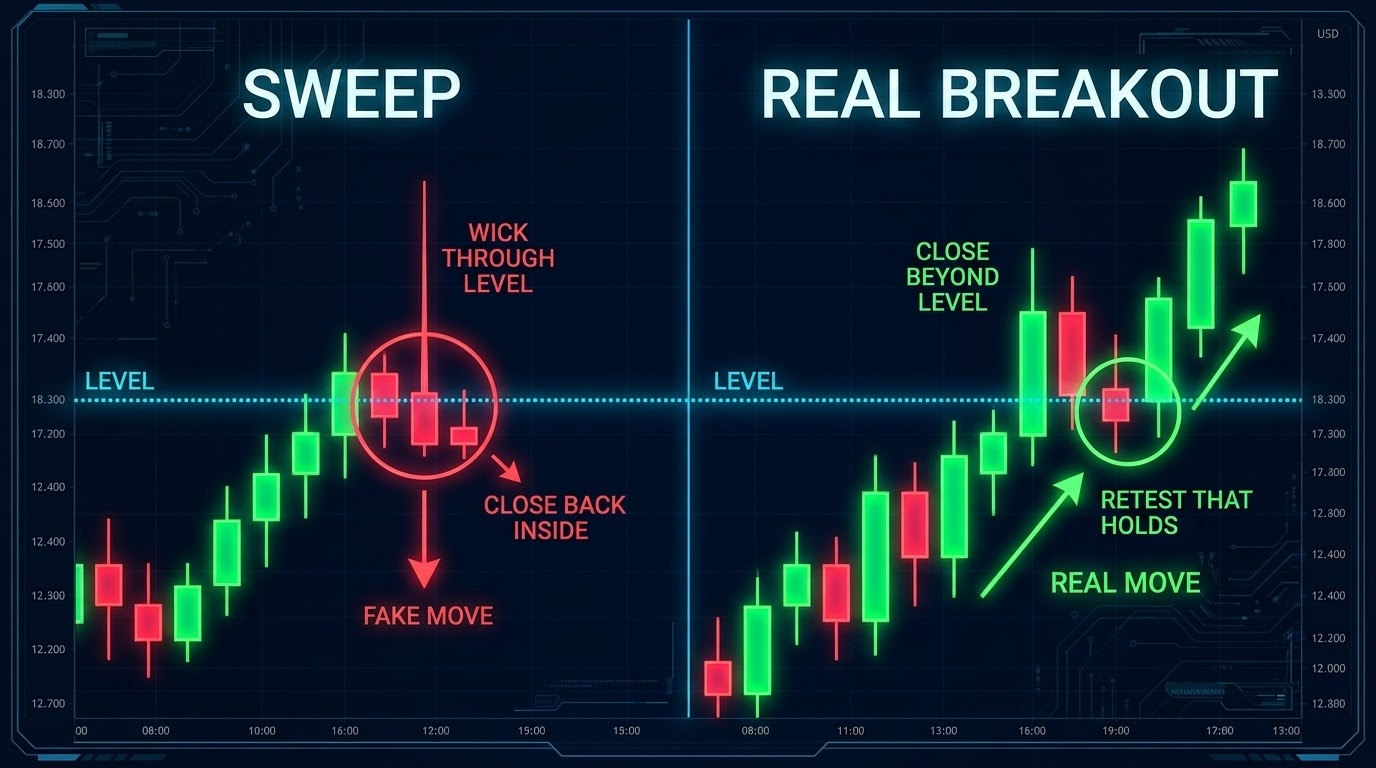
Real breakout. A candle closes beyond the level. Price holds there on the retest and volume stays strong.
When you are not sure wait for the candle close. A close tells you more than a wick.
How to trade it step by step?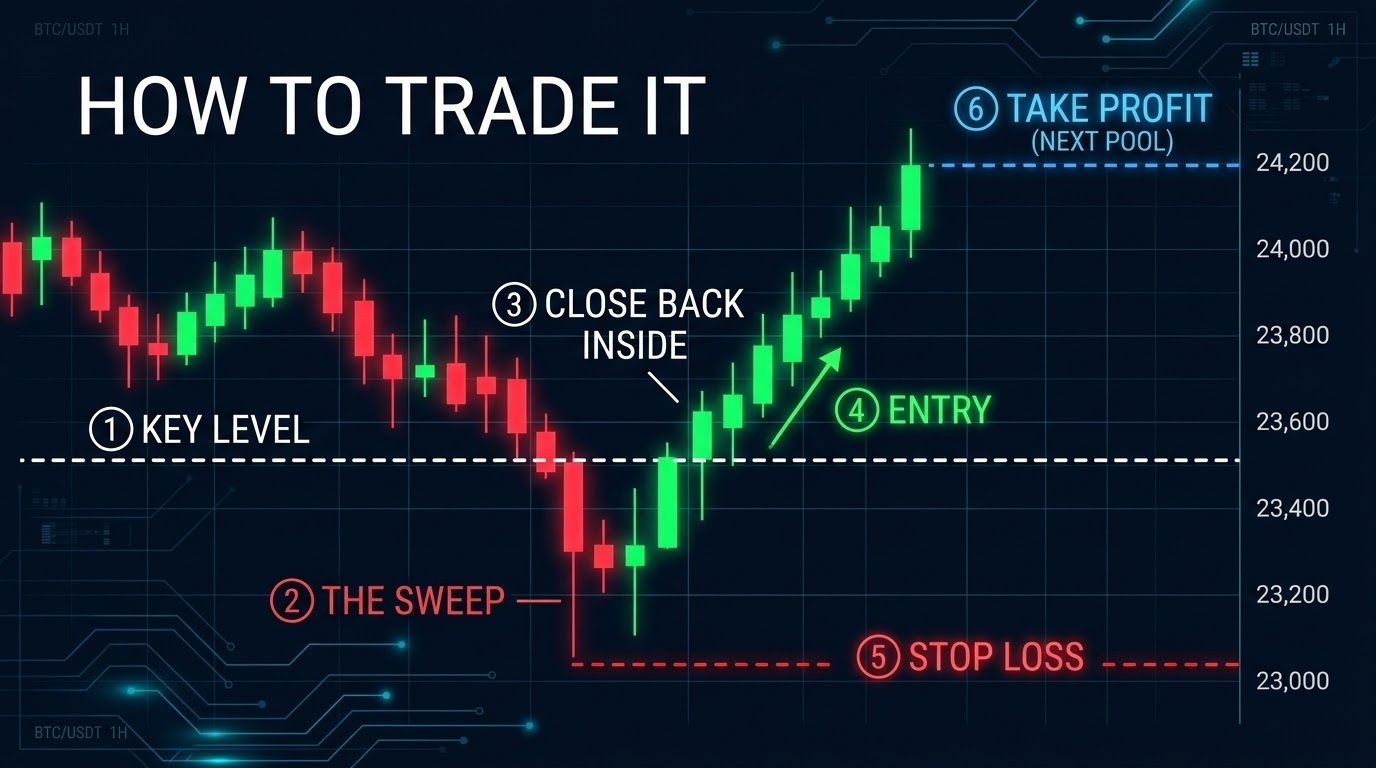
Mark the obvious highs and lows on a higher timeframe like the 1h or 4h chart.
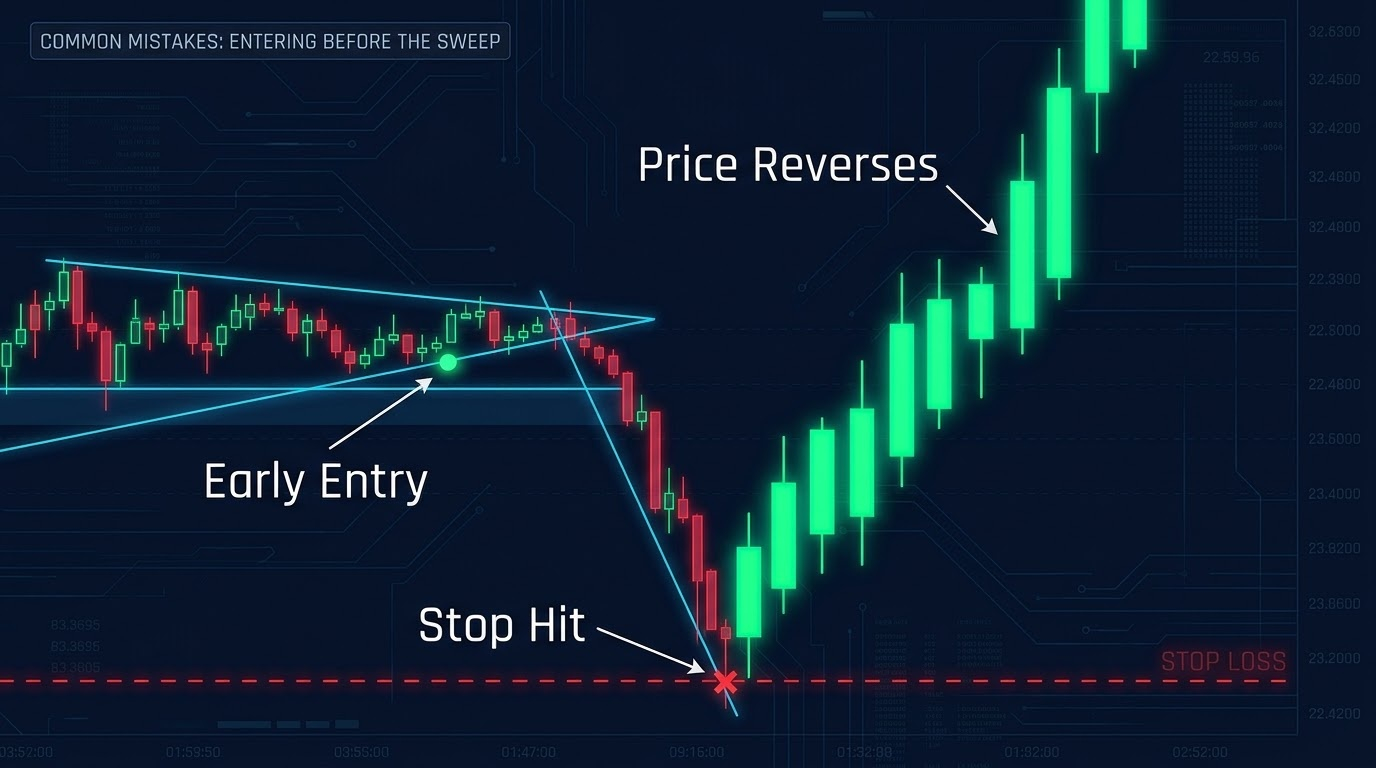
Wait for price to reach the level. Do not enter before it gets there.
Look for a wick through the level and a close back inside.
Enter after the confirmation candle and not during the spike.
Put your stop loss just beyond the wick.
Take profit at the next pool on the other side
Our mistakes!
Entering before the sweep happens
Calling every wick a sweep
Trading against a strong trend
Using big size with a wide stop
Ignoring the higher timeframe
Liquidity is a way to read the chart. It is not a promise. Sometimes price sweeps a level and keeps going and the level breaks for real. Always use a stop loss and keep your size small especially on coins with low volume.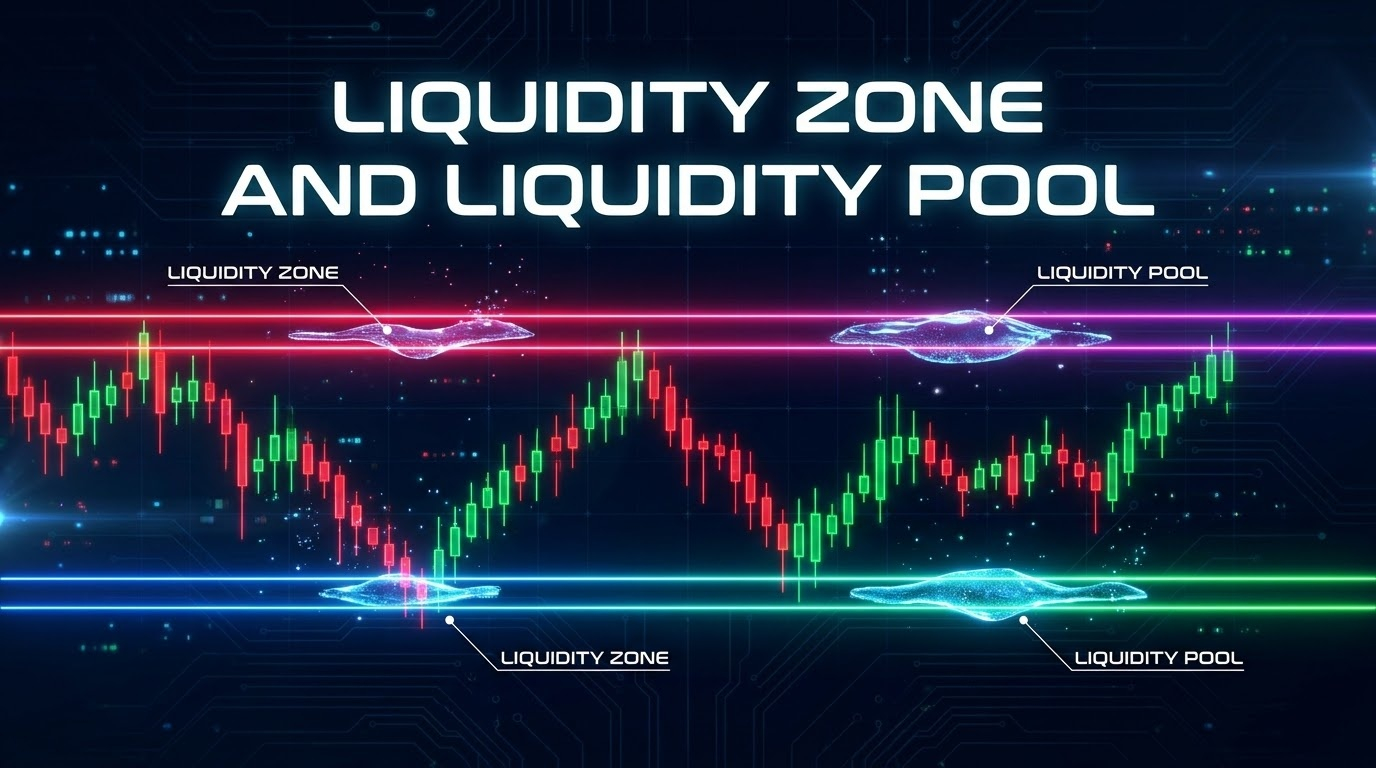
Before every trade ask one simple thing. Where are the stops sitting and who needs them. When you can answer that you stop chasing candles and start trading with a plan.
Your Loving Mentor ❤️