
🚨 BITCOIN WARNING: BTC COULD RETEST $72,300–$75,700! 📉
Bitcoin is facing a key resistance zone, and market analyst Murphy believes a pullback could be on the horizon if a historical pattern repeats.
📊 What Happened in 2023?
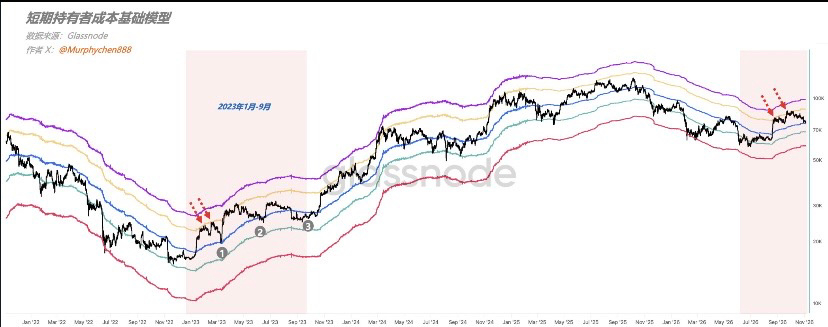
Between January and September 2023, Bitcoin encountered resistance three times at the upper band of the Short-Term Holder Realized Price (STH-RP).
Each rejection triggered a correction:
🔹 The first pullback reached the STH-RP.
🔹 The second moved slightly below it.
🔹 The third dropped between the STH-RP and its lower deviation band.
📍 Key Bitcoin Levels to Watch
According to Murphy’s November 4 analysis:
• STH-RP: $75,700
• Midpoint support: $72,300
• Lower deviation band: $68,900
If the previous pattern plays out again, BTC could revisit $75,700 or decline toward $72,300. A deeper correction could also bring the lower support region into focus.
🔥 Seller Exhaustion Signal
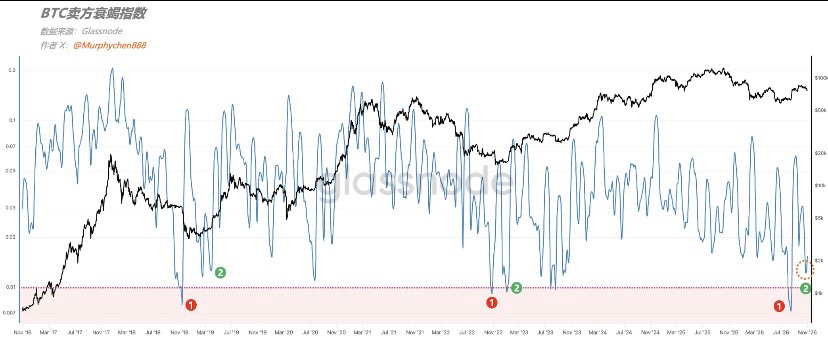
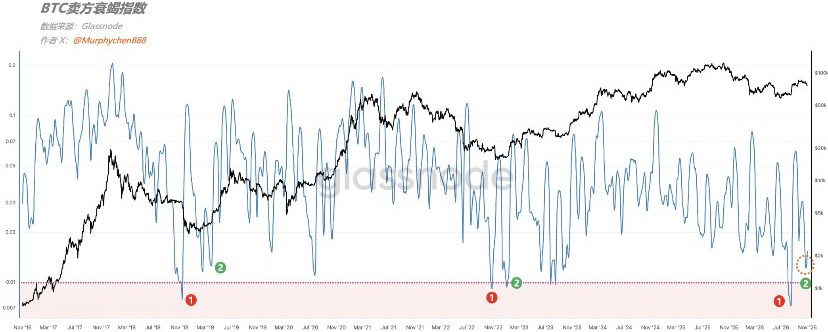
Murphy also highlighted his Seller Exhaustion Index.
When Bitcoin dropped toward $77,000, the indicator recorded its second-lowest reading of the current cycle, with only the August reading showing greater seller exhaustion.
⚠️ Important Takeaway
Murphy emphasized that his analysis is intended to develop trading strategies rather than predict future price movements.
These levels represent potential scenarios, not guaranteed outcomes.
This content is for informational purposes only and does not constitute financial advice.