$BTC ₿ BTC/USDT – Bitcoin Market Analysis
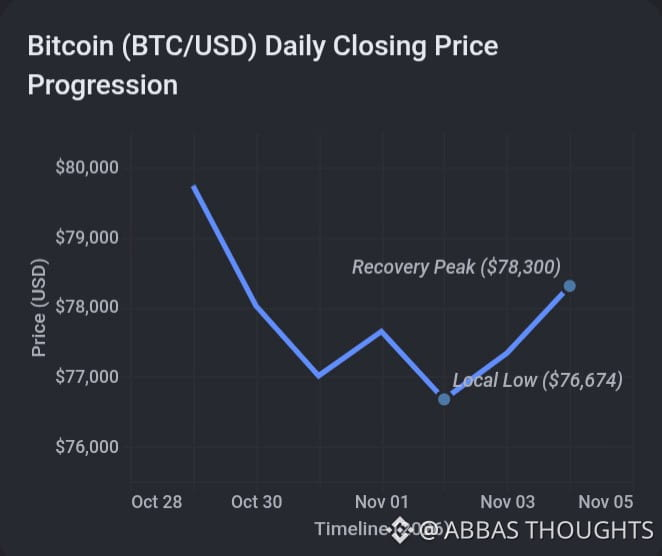
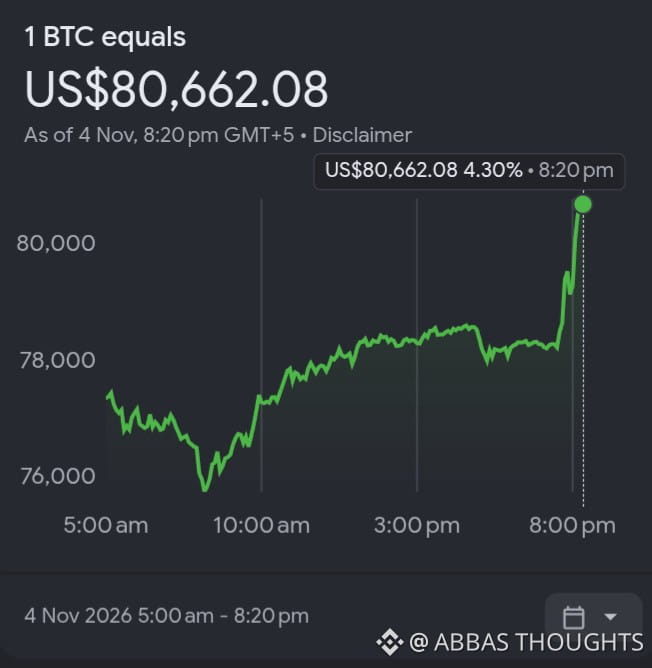
Bitcoin is showing signs of recovery after recent selling pressure. Bulls are attempting to regain control, but key resistance levels remain important.
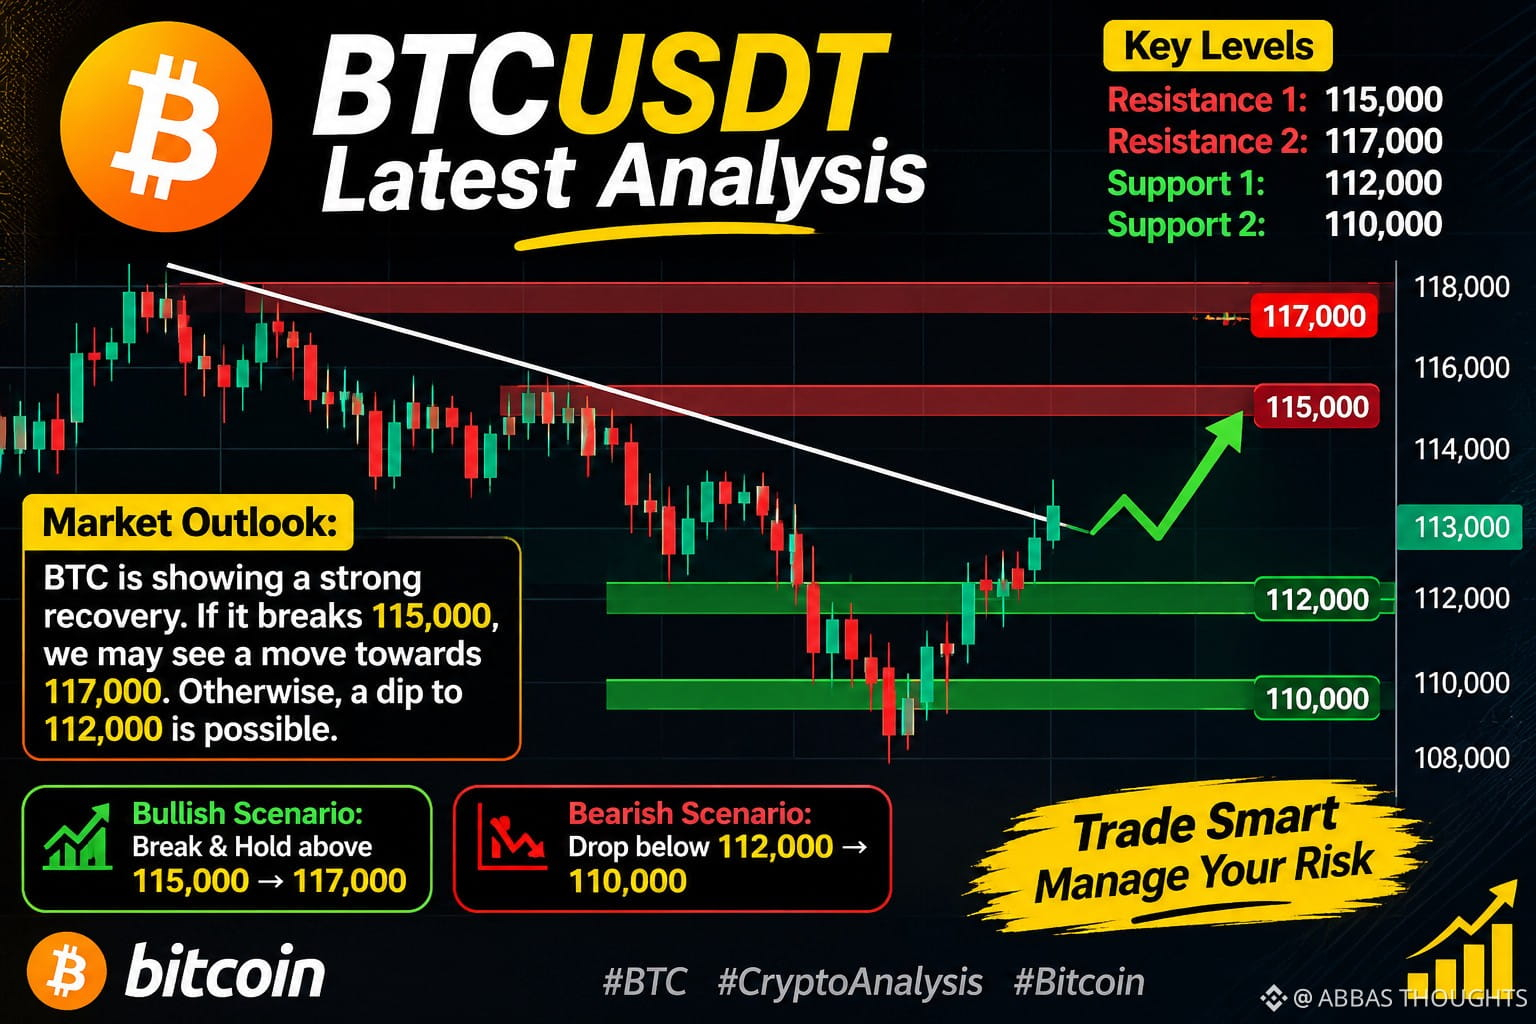
📊 Key Technical Levels
🔴 Resistance 1: $115,000
🔴 Resistance 2: $117,000
🟢 Support 1: $112,000
🟢 Support 2: $110,000
📈 Bullish Scenario:
If BTC breaks and holds above $115,000, the next potential target could be $117,000.
📉 Bearish Scenario:
If BTC loses the $112,000 support, further downside toward $110,000 is possible.
🎯 Trading Strategy:
Wait for confirmation before entering any trade. Always use proper stop-loss and risk management.
⚠️ Trade carefully. This is market analysis, not financial advice.
#Bitcoin #BTC #CryptoAnalysis #BTCUSDT #CryptoTrading #Binance #Bybit
Bitcoin is showing signs of recovery after recent selling pressure. Bulls are attempting to regain control, but key resistance levels remain important.
📊 Key Technical Levels
🔴 Resistance 1: $115,000
🔴 Resistance 2: $117,000
🟢 Support 1: $112,000
🟢 Support 2: $110,000
📈 Bullish Scenario:
If BTC breaks and holds above $115,000, the next potential target could be $117,000.
📉 Bearish Scenario:
If BTC loses the $112,000 support, further downside toward $110,000 is possible.
🎯 Trading Strategy:
Wait for confirmation before entering any trade. Always use proper stop-loss and risk management.
⚠️ Trade carefully. This is market analysis, not financial advice.
#Bitcoin #BTC #CryptoAnalysis #BTCUSDT #CryptoTrading #Binance #Bybit