

Forecast Period: November 2026 – February 2027
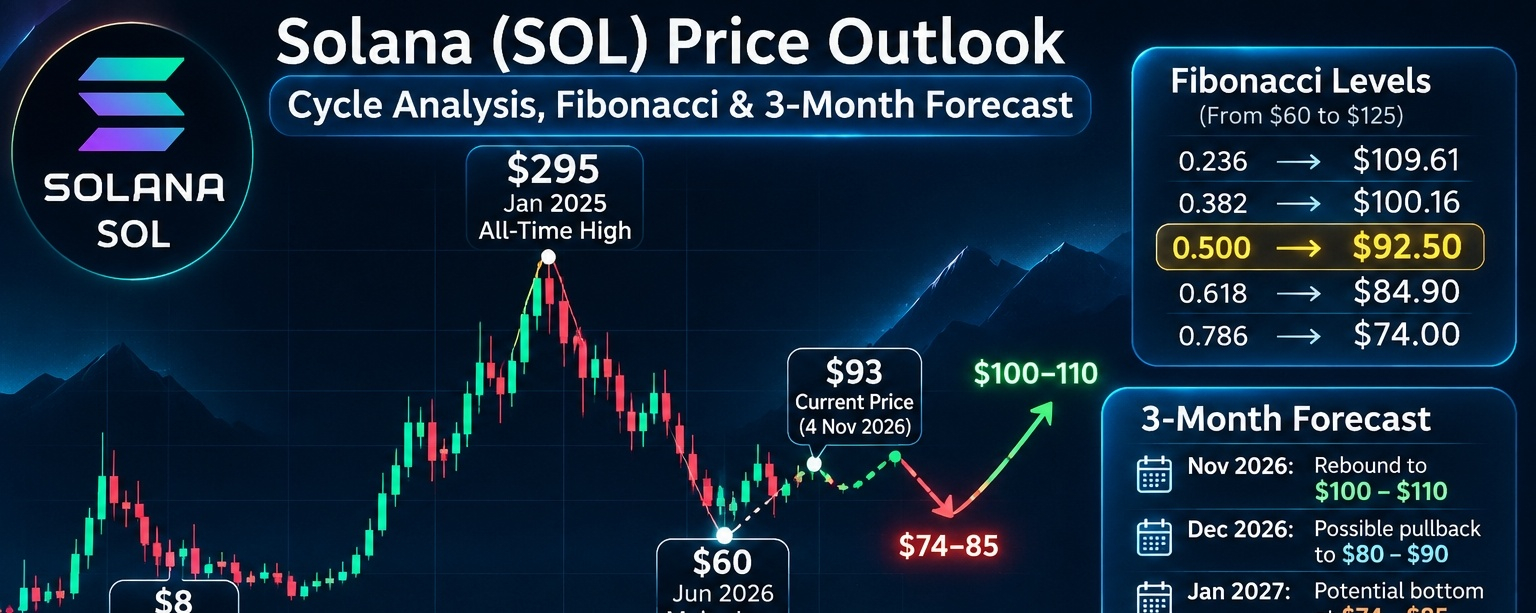
Solana (SOL) is entering a critical phase following significant price fluctuations over the past six months. After recovering from approximately $60 in June 2026 to nearly $125 in September, SOL experienced renewed selling pressure, retreating toward the $90–$95 range in early November.
Based on historical market cycles, price performance, time-cycle analysis, and Fibonacci retracement levels, the technical outlook suggests that Solana may experience another corrective phase before establishing a sustainable bullish trend.
1. Historical Market Cycle Analysis
Solana reached a major cycle low near $8 in December 2022 before entering a powerful bullish cycle that eventually pushed its price toward an all-time high of approximately $295 in January 2025.
Since that peak, SOL has experienced a prolonged correction, declining to approximately $60 in June 2026, representing a drawdown of nearly 80%.
Historically, corrections of this magnitude can indicate that a substantial portion of a bearish cycle has already unfolded. However, they do not necessarily confirm that the final market bottom has been established.
2. Fibonacci Retracement Analysis
Applying Fibonacci retracement levels to Solana's recent upward movement from approximately $60 to $125 highlights several important technical zones:
$92.50: The 50% retracement level and an important short-term decision zone.
$84.90: The 61.8% Fibonacci level, representing a potentially significant support area.
$74.00: The 78.6% retracement level, where a deeper correction could potentially stabilize.
$60.00: The previous major low, which remains a critical structural support level.
Based on this framework, the $74–$85 range emerges as a key potential accumulation and reversal zone over the coming months.
However, Fibonacci levels should be treated as areas of interest rather than guaranteed reversal points.
3. Three-Month Time-Cycle Forecast
November 2026 — Potential Short-Term Recovery
Solana may attempt a temporary recovery toward $100–$110 as oversold conditions encourage renewed buying interest. Nevertheless, the broader technical structure remains vulnerable until stronger resistance levels are reclaimed.
December 2026 — Possible Corrective Pressure
If SOL fails to sustain its recovery, renewed selling pressure could drive the price toward $80–$90. This period may become important in determining whether buyers can defend the existing market structure.
January 2027 — Potential Bottom Formation
January could provide a possible window for a significant market bottom, particularly if SOL approaches the $74–$85 support region.
Confirmation would require stronger buying volume, improving momentum, and evidence of sustained demand.
February 2027 — Potential Recovery Phase
If the support region holds, Solana could begin recovering toward $100–$110, with a potential extension toward $125 if bullish momentum strengthens.
These monthly projections represent conditional scenarios, not statistically confirmed turning-point dates.
4. Could Solana Fall to $26 in 2027?
The possibility of Solana declining toward $26 cannot be completely dismissed, particularly during an extended cryptocurrency bear market.
However, such a scenario would likely require a decisive breakdown below the major $60 support level, accompanied by continued deterioration in broader cryptocurrency market conditions.
At present, the $26 target should be viewed as an extreme bearish scenario rather than the primary expectation for the next three months.
5. Final Market Outlook
The most likely scenario in this technical assessment involves three stages:
Short-term rebound: A potential recovery toward $100–$110.
Corrective phase: A possible decline toward the $74–$85 support zone during December or January.
Recovery attempt: A potential rebound toward $100–$110 by February 2027 if buyers successfully defend support.
A sustained breakout above $110, followed by a confirmed move beyond $125, would strengthen the bullish outlook and potentially invalidate the expected deeper correction.
Conversely, a weekly close below $60 would significantly weaken the market structure and increase the risk of a prolonged bearish phase.
Conclusion
Solana may be approaching the later stages of its broader corrective cycle, but a definitive market bottom has not yet been confirmed.
From a cycle-based and Fibonacci perspective, the $74–$85 region represents an important area to monitor for a potential reversal.
The next three months could prove decisive in determining whether SOL is preparing for a new bullish cycle or remains vulnerable to further downside.
Primary forecast: Short-term rebound → deeper correction → potential recovery.
Key support: $74–$85
Major structural support: $60
Initial recovery target: $100–$110
Bullish confirmation zone: $125+
Disclaimer: This analysis reflects a technical market scenario based on historical price behavior, Fibonacci retracement, and cycle interpretation. It is not a guaranteed forecast or financial advice. Cryptocurrency markets are highly volatile, and actual outcomes may differ significantly from these projections.