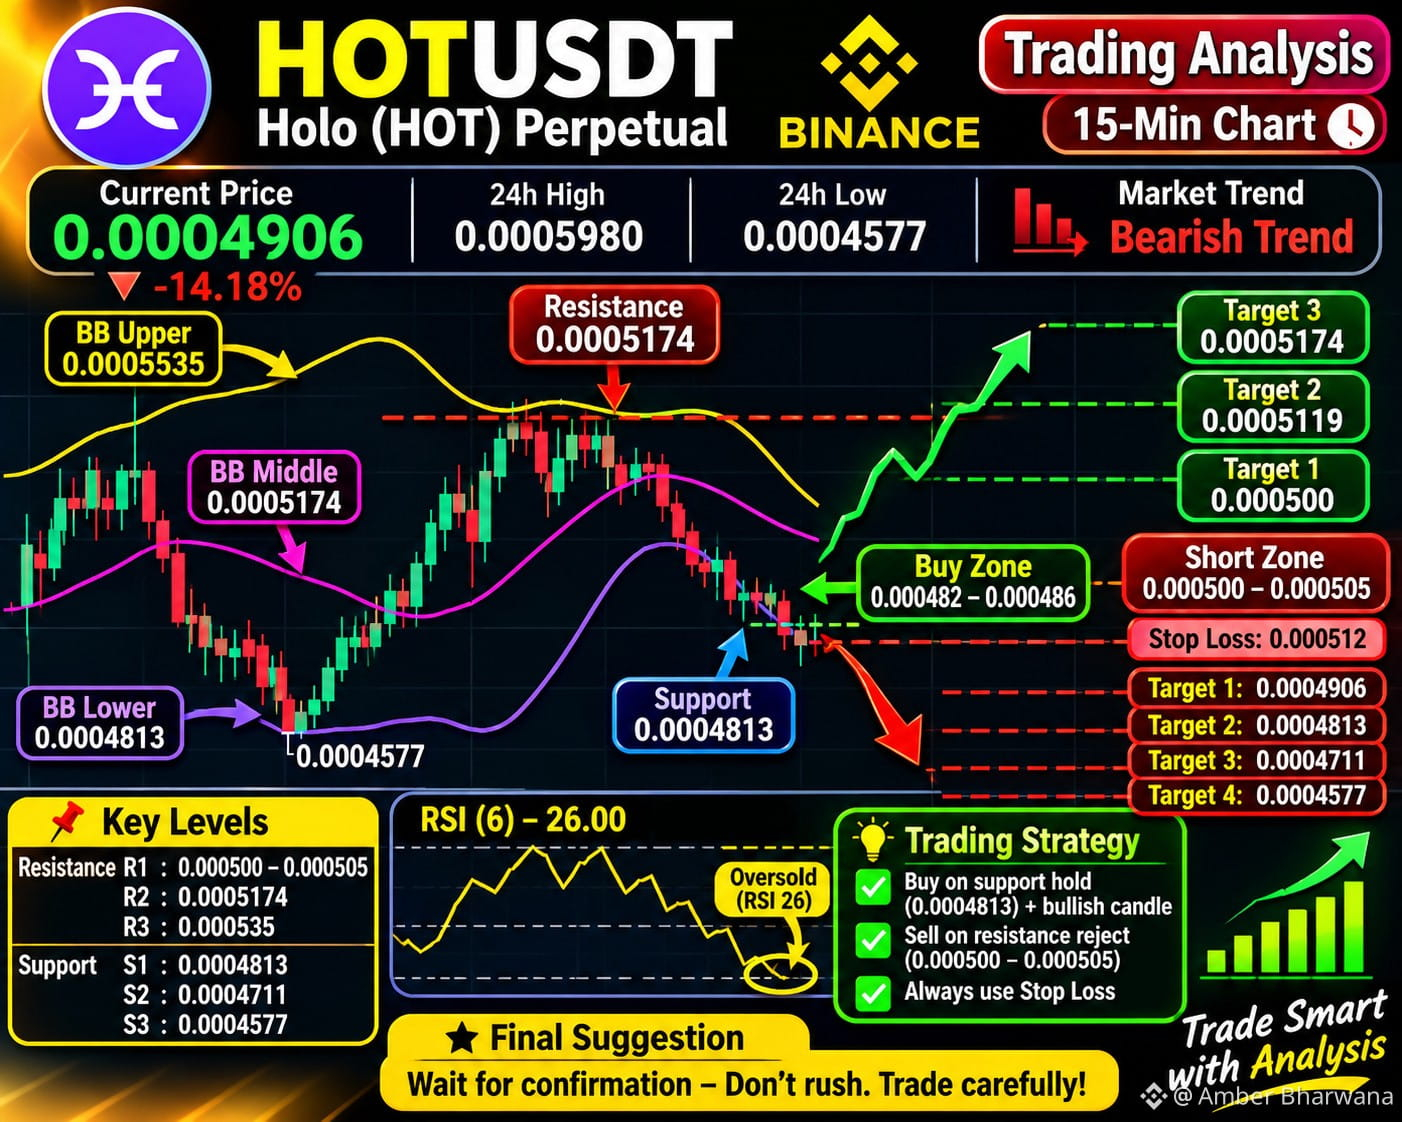
💥 HOTUSDT – Trading Analysis
HOT is showing bearish momentum, but RSI at 26 indicates an oversold market. A bullish bounce is possible if support holds.
❤️ Buy Zone: 0.000482–0.000486
❤️ Targets: 0.000500 / 0.0005119 / 0.0005174
❤️ Short Zone: 0.000500–0.000505
❤️ Stop Loss: 0.000512 (Short setup)
❤️ Key Support: 0.0004813
Watch the breakout carefully. Wait for candle confirmation before entering. Manage your risk!
#HOT #Holo #Binance #CryptoTrading #TechnicalAnalysis
HOT is showing bearish momentum, but RSI at 26 indicates an oversold market. A bullish bounce is possible if support holds.
❤️ Buy Zone: 0.000482–0.000486
❤️ Targets: 0.000500 / 0.0005119 / 0.0005174
❤️ Short Zone: 0.000500–0.000505
❤️ Stop Loss: 0.000512 (Short setup)
❤️ Key Support: 0.0004813
Watch the breakout carefully. Wait for candle confirmation before entering. Manage your risk!
#HOT #Holo #Binance #CryptoTrading #TechnicalAnalysis