$BTC $BTC $BNB
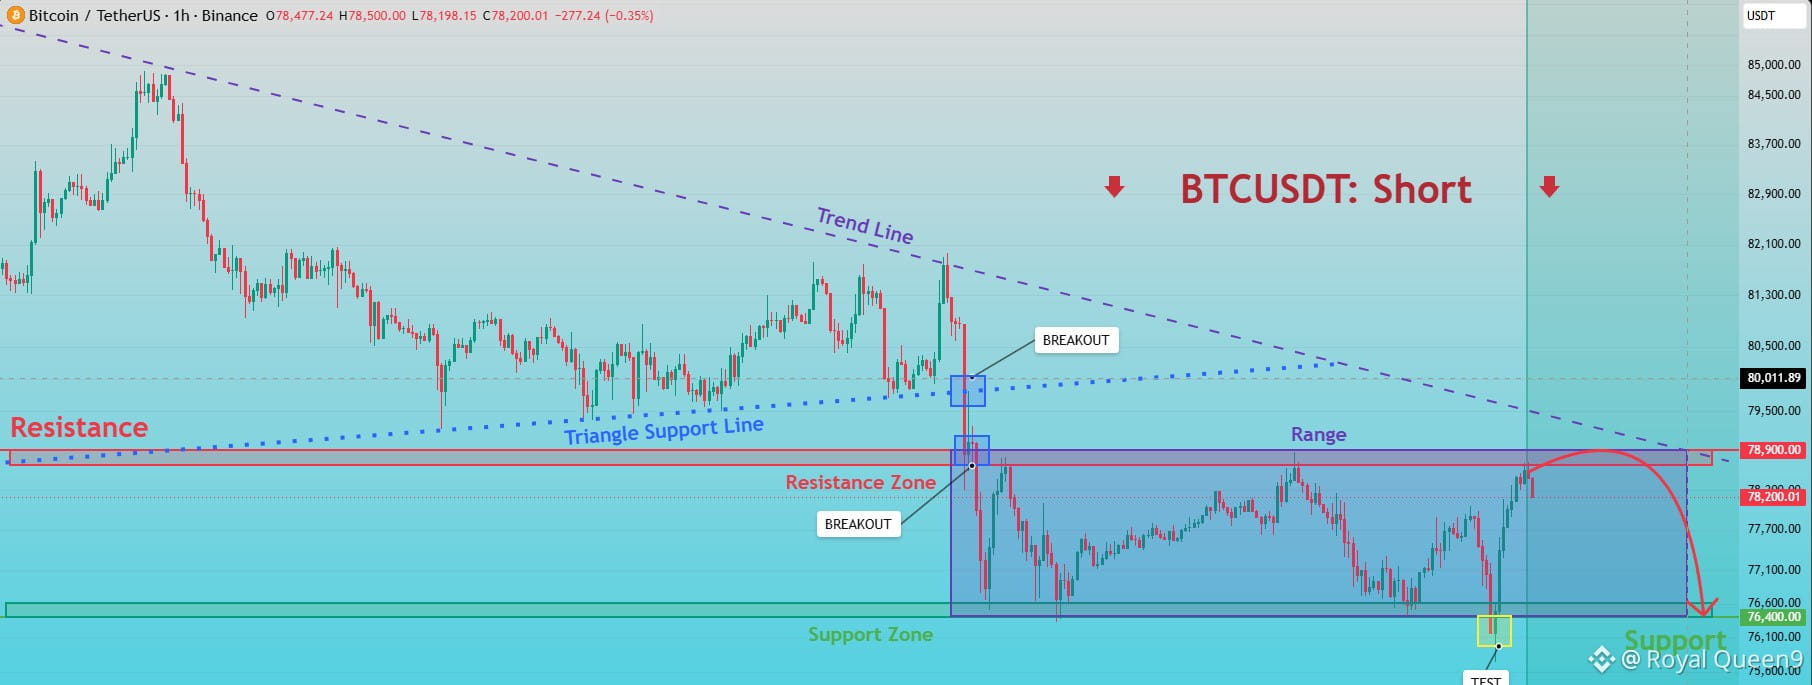
The BTC/USDT 1-hour chart shows a bearish trend with price consolidating in a sideways range.
Overall trend: Downward, below the descending trendline.
Pattern: A triangle formation broke down, followed by a sharp bearish move.
Current range: 76,400–78,900.
Resistance zone: 78,800–78,900, where price is facing selling pressure.
Support zone: 76,400–76,600, where buyers have repeatedly defended the price.
Current price: Around 78,200, recovering toward range resistance .
$btc
The BTC/USDT 1-hour chart shows a bearish trend with price consolidating in a sideways range.
Overall trend: Downward, below the descending trendline.
Pattern: A triangle formation broke down, followed by a sharp bearish move.
Current range: 76,400–78,900.
Resistance zone: 78,800–78,900, where price is facing selling pressure.
Support zone: 76,400–76,600, where buyers have repeatedly defended the price.
Current price: Around 78,200, recovering toward range resistance .
$btc