$BTC USDT — Bulls Are Pushing Bitcoin Towards $79K! 🚀
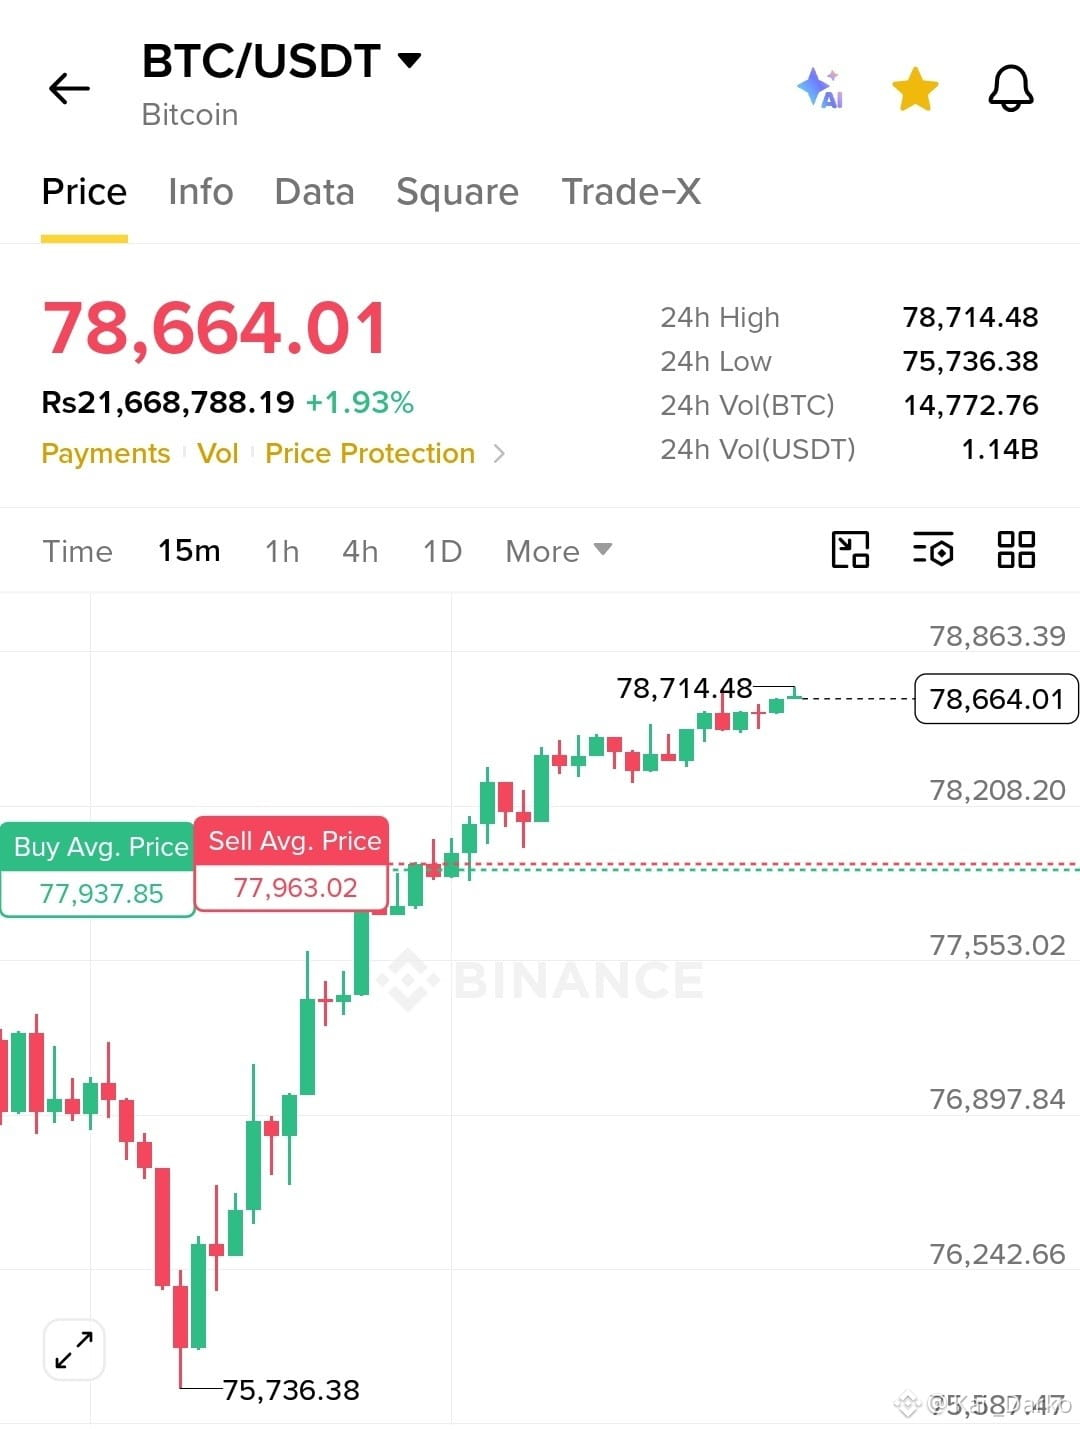
Bitcoin is showing impressive bullish strength on the 15-minute chart. After a sharp market flush towards $75,736, buyers stepped in aggressively and drove BTC back to $78,664, currently up around 1.93%. What interests me most is the recovery structure: price is forming higher highs and higher lows, showing that buyers are still controlling short-term momentum.
📊 Market Structure & Technical Analysis
The recovery from $75,736 has been strong, with multiple bullish candles pushing through previous resistance. BTC has also reclaimed the $77,937–$77,963 area, where the displayed average buy and sell prices are located.
Now, price is consolidating just below the important $78,714 resistance, which is also the 24-hour high. This is where the real test begins.
The immediate support zone sits around $78,200–$78,400, while $77,937 remains an important lower support reference.
The current structure favors buyers, but chasing price directly into resistance is not my preferred strategy.
EMA, RSI, MACD and Fibonacci readings are not displayed, so their confirmation cannot be established from this screenshot.
🎯 My Trading Plan
* Direction: Bullish (Long)
* Entry Zone: $78,200–$78,400
* Stop Loss: $77,900
* TP1: $78,714
* TP2: $78,860
* TP3: $79,000
I prefer waiting for a healthy pullback into support rather than entering after an extended move. A successful breakout above $78,714, followed by a strong retest, could open the door towards $78,860 and eventually $79,000.
⚠️ Risk Management
A sustained move below $77,900 would weaken this bullish setup and invalidate the proposed trade. Keep position size reasonable, protect your capital, and consider securing partial profits at each target.
My Final View 👀
BTC is showing a promising recovery, but $78,714 is the level bulls must conquer. A confirmed breakout could create another opportunity for buyers.
Are you expecting BTC to break $79K, or will sellers defend this resistance again? 📈
#USMidterms-WhatAreMarketsExpecting?
Bitcoin is showing impressive bullish strength on the 15-minute chart. After a sharp market flush towards $75,736, buyers stepped in aggressively and drove BTC back to $78,664, currently up around 1.93%. What interests me most is the recovery structure: price is forming higher highs and higher lows, showing that buyers are still controlling short-term momentum.
📊 Market Structure & Technical Analysis
The recovery from $75,736 has been strong, with multiple bullish candles pushing through previous resistance. BTC has also reclaimed the $77,937–$77,963 area, where the displayed average buy and sell prices are located.
Now, price is consolidating just below the important $78,714 resistance, which is also the 24-hour high. This is where the real test begins.
The immediate support zone sits around $78,200–$78,400, while $77,937 remains an important lower support reference.
The current structure favors buyers, but chasing price directly into resistance is not my preferred strategy.
EMA, RSI, MACD and Fibonacci readings are not displayed, so their confirmation cannot be established from this screenshot.
🎯 My Trading Plan
* Direction: Bullish (Long)
* Entry Zone: $78,200–$78,400
* Stop Loss: $77,900
* TP1: $78,714
* TP2: $78,860
* TP3: $79,000
I prefer waiting for a healthy pullback into support rather than entering after an extended move. A successful breakout above $78,714, followed by a strong retest, could open the door towards $78,860 and eventually $79,000.
⚠️ Risk Management
A sustained move below $77,900 would weaken this bullish setup and invalidate the proposed trade. Keep position size reasonable, protect your capital, and consider securing partial profits at each target.
My Final View 👀
BTC is showing a promising recovery, but $78,714 is the level bulls must conquer. A confirmed breakout could create another opportunity for buyers.
Are you expecting BTC to break $79K, or will sellers defend this resistance again? 📈
#USMidterms-WhatAreMarketsExpecting?